A mean reversion strategy to the stock market can be applied in various ways. Investors can take advantage of mean reversion through value investing or a momentum-based trading strategy. Let’s take a look at mean reversion in this blog post – what it is and how it can be used with a technical analysis approach to the stock market.
Click to jump to a section:
- What is the Mean Reversion Strategy?
- How to Apply the Mean Reversion Strategy
- Mean Reversion Strategy: 90-Day Moving Average
- Why Use the Mean Reversion Strategy?
- Comparing Trigger Points
- Summary

What is the Mean Reversion Strategy?
Mean Reversion is not something that’s specifically tied to the stock market by any means. It applies to many things. A great example is a player shooting free throws in basketball.
If a basketball player who historically shoots 75% from the free throw line has just made 10 in a row, odds are that, eventually, that player will start to miss more free throws. So, his average reverts back to that normal mean of 75%.
Same for the opposite – if the player misses 10 in a row, bet the house that they make the next one! Not guaranteeing they will, but looking at historical averages, they should slowly revert back to that 75% mean. This is a very basic example, but it’s the essence of mean reversion.
Now, time for the fun, nerdy stuff.
A Mean Reversion Strategy in the stock market looks at the mean price of a stock over a certain period of time. It advises selling that stock when the price is significantly above that mean price, and buying when it is significantly under that mean price.
This makes a large assumption that prices will typically stay fairly consistent and not make drastic changes, which can obviously impact the stock’s average price.
How to Apply the Mean Reversion Strategy
To utilize this strategy, follow these steps:
- Determine the time period I want to use – typically, I will use a 90-day moving average.
- Determine the high and low points, i.e. the points where you want to buy and sell the stock.
- Be prepared to pull the trigger and buy when the stock is low and sell when the stock is high.
In general, the Mean Reversion Strategy tends to work best with stocks that are very cyclical. Examples of this are energy or consumer staples, as they are affected by macroeconomic trends that tend to correct over time.
Man, isn’t that easy? It might seem that way, but it takes some effort and monitoring on your part. The difficulty comes when you have to continue monitoring a stock over a significant period, in addition to the willpower to follow through with your plan and not fall in love or hate with a stock.
Mean Reversion Strategy: 90-Day Moving Average
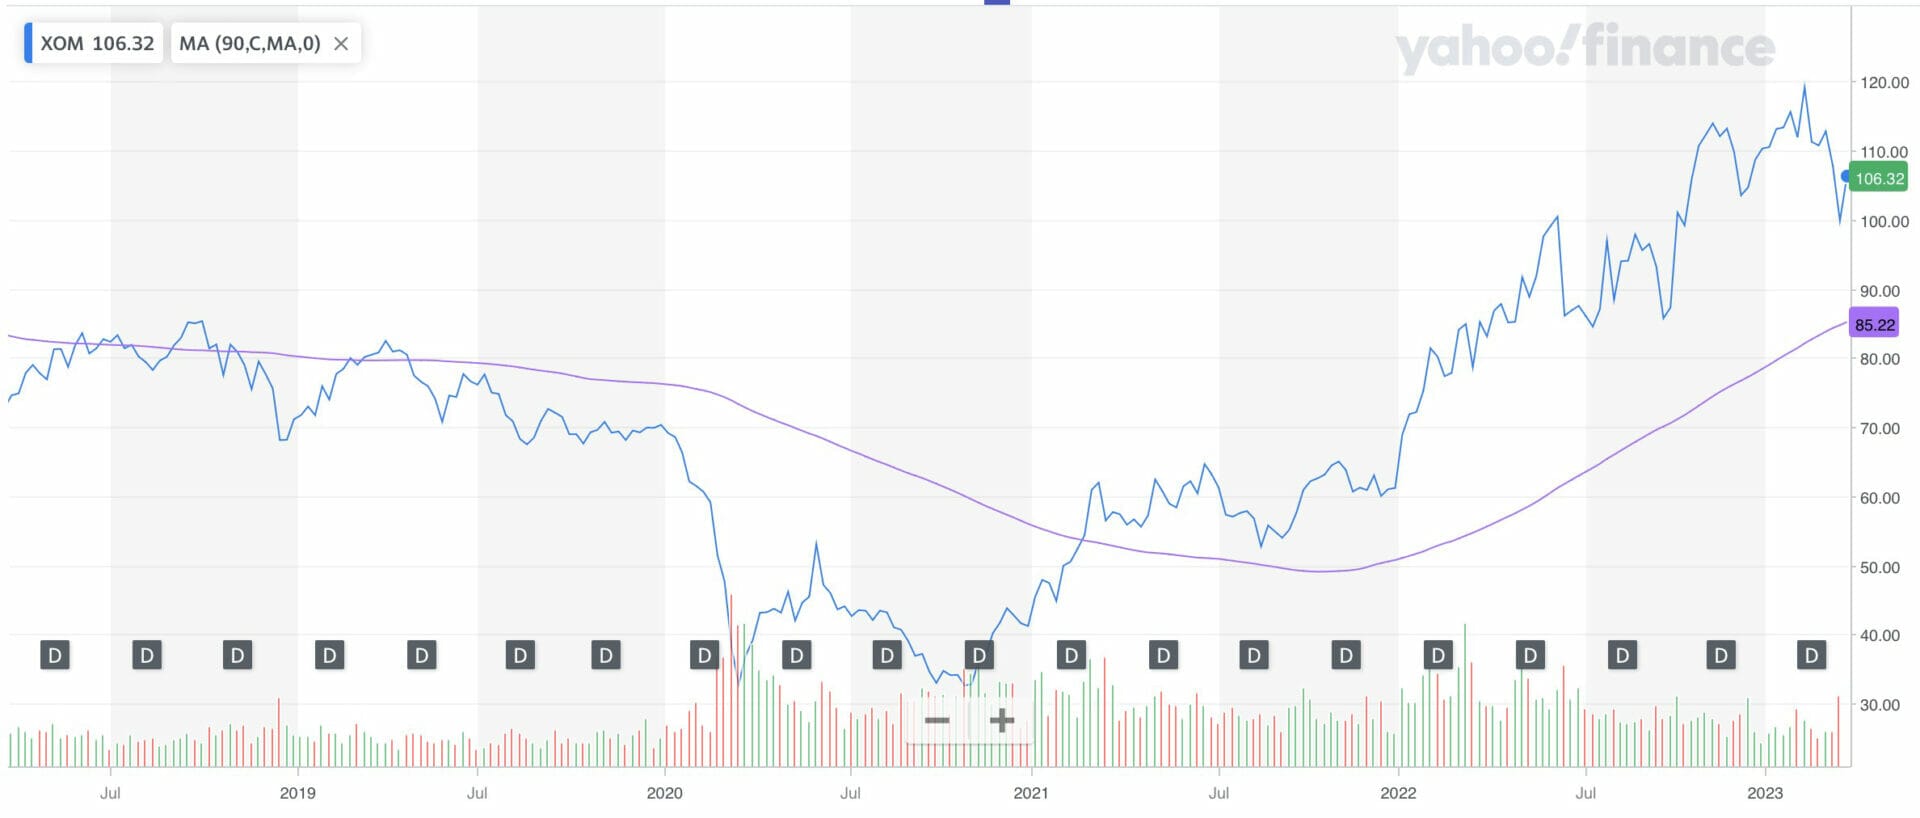
For example, let’s take a look at XOM. Below is a 5-year chart of closing stock prices and a 90-day moving average line. The moving average line is the smooth purple line. Typically, I would like to target buying a stock when it is 8% below the 90-day moving average and selling when it is 8% above the 90-day moving average.
In this example, 8% is my trigger point.
Why Use the Mean Reversion Strategy?
The primary purpose of the Mean Reversion Strategy is as a guide for when to buy or sell a stock.
The process of trading stocks can be a complicated, overwhelming process. When you trade a stock, its current price, historical performance, and predicted future performance all play roles in your decision. Historically, it requires a lot of manual calculations and tracking to implement.
The Mean Reversion Strategy is a more automated concept with the same goal. It takes past performance into account through the 90-day moving average. Then it takes care of when exactly to buy and sell through the trigger point.
Comparing Trigger Points
I decided to go full nerd and track the last XOM opening stock prices from 2014 to 2019 and implemented this Mean Reversion Strategy.
I ran two cases that were very similar, with the only differences being 8% as a trigger for buy/sell and the other case was 5% being my trigger.
I imagined that I started on 10/2/14 with 0 shares of XOM. The first day the stock fell < 8% above the 90-day moving average price, I bought 10 shares. Then, I sold those same 10 shares the first day the stock price rose to > 8% above the 90-day moving average, rinse and repeat.
I did the same in the other case, except with a 5% trigger point. The results might surprise you…
As you can see, when looking at the 8% trigger point, the total return was -13.23% when I take my current value of stocks and add that to the increased value from selling my stocks throughout this period.
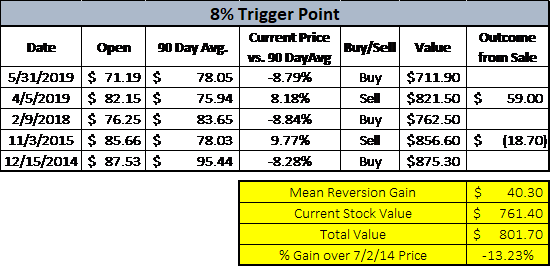
-13.23% sounds pretty dang bad, and it is. But let’s take a look at the 5% example now:

Still negative? But note the huge increase in the Mean Reversion Gain value of $184.90. You gained $18.49/share on average throughout this mean reversion process.
So, why would you ever want to do this? Well, let’s take a look at what would’ve happened if you just bought 10 shares on 10/2/2014 and held onto them.

OUCH! That’s the benefit of the Mean Reversion Strategy. We gained 5.34% for an 8% trigger point and 16.02% with a 5% trigger point relative to buying and holding.
Summary
It’s really a blanket of safety. It will alert you when the stock might be overvalued and to sell, and let you know when it’s undervalued and time to buy. This helps you identify the perfect time to buy low and sell high – the most common advice that you have likely ever heard about investing.
Overall, the Mean Reversion Strategy is a great tool to have in your investing toolbelt, but it should not be the “end all, be all” of investing.
This is a great tool that can help show you what stocks can be undervalued and identify some value traps you might be falling into.
There is always the chance that you might buy before the stock bottoms and/or sell before that stock peaks. No strategy is perfect. But the general goal is that you’re constantly finding good values and buying/selling at opportune times – as you have likely heard, “Don’t let perfect be the enemy of good.”
