With the S&P down 16% from 52-week highs, the correction in the market is starting to get me excited about stock valuations again and putting fresh savings to work in my investment portfolio. Technology companies have taken a particularly hard hit with the Nasdaq down 30% over the past year. Meta is one such company that has been hit particularly hard with its stock price down 67% over the past year to sit at $111.45.

Meta, or Facebook, is a company I never thought I would own as a value investor, but 10 years after its IPO on May 18, 2012, that time has come. Results at Facebook have been poor of late, which has sent the stock plummeting with no help from overall market sentiment during the interest rate hike cycle. The company is reaching the mature part of its business lifecycle and the valuation is adjusting which is normal. This type of valuation adjustment can often be brutal as optimistic growth investors get a rude awakening. But overcorrections, such as this one, open an opportunity for long-term value investors to step in and support the stock price.
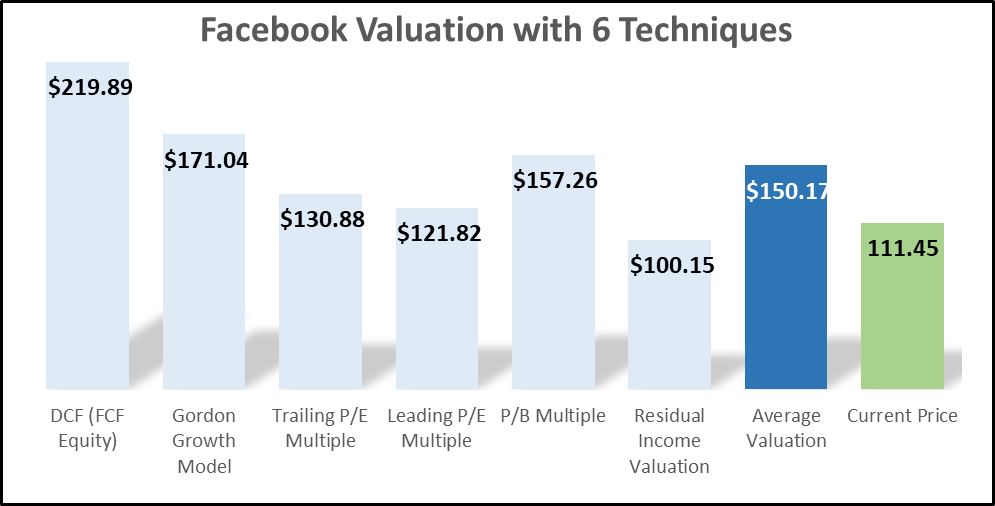
From an investment standpoint, Meta does have a strong base business in its Facebook (my preferred name for the company) and Instagram platforms. These platforms help the company generate a good deal of advertising revenue which should be able to support a dividend as we will discuss later. Facebook is starting to look very attractive 34.7% below its average valuation of $150.17 across six different techniques.
Since I started thinking about writing this article, Facebook’s stock price has already started to slightly recover. The company has been quick to roll back its spending by announcing on Nov 9th they will be cutting 11,000 jobs, which is great news and supports the thesis of this valuation. If we assume these 11,000 employees had an average all-in salary and overhead of $200,000, this will contribute to getting back part of those margins. Facebook is already trading pretty cheap at 10.4x trailing-twelve month (TTM) earnings, so these potential margin gains only add to the potential upside.
In this article, we will run Facebook through the IFB Equity Model spreadsheet to get a sense of its valuation and will play around with the operating expenses of the company and revenue growth (or decline!) rates.
This model is one of the courses and spreadsheets available on the IFB products page and allows users to easily value a company in a fully customizable model using six different techniques which grabs data automatically from forecasted 10-year financial statements.
Facebook is the World’s Personal Address Book
Meta’s products have become a daily part of life for its 1.98 billion daily active users, which increased 3% year-over-year (YoY) for the quarter ended September 30, 2022. On a monthly average user base (a metric I would count myself as being part of), users are roughly another 50% higher at 2.96 billion to end the quarter which was an increase of 2% YoY.
All of these users help Meta generate an enormous amount of revenue, mainly from advertisements. For the latest quarter, revenue at Meta was $27.71 billion, which although it decreased 4% YoY, was actually 2% higher YoY in constant currency terms. Ad impressions increased 17% YoY but this was offset by the price per ad decreasing 18% YoY. This decrease in the price per ad is worrisome if it turns into a trend; investors should keep an eye out for it.
Over the past 5 years to the last fiscal 2021 year, Meta has seen its revenue grow from $40.7 billion to $117.9 billion for a compounded annual growth rate of 31.1%. While growth has slowed in the TTM period, that is expected of any business reaching the mature stage of its business cycle. This is the business stage where management should begin to focus on profitability and cash flows while starting to reward shareholders with dividends and share buybacks. Meta repurchased $6.55 million of stock in the latest quarter and still has $17.78 billion authorized for repurchase. With the strong cash flows to make this happen, I hope for more repurchases in the near future, as well as the initiation of a dividend.
The networking effect that Facebook has developed over the years is so strong that it makes it hard and sticky for an alternative to develop. Whether it is getting a reminder of friends and family birthdays through Facebook, keeping in touch with old friends through WhatsApp or Facebook Messenger, or seeing the latest stories from friends on Instagram, these networking effects are hard to replicate from startup competitors.
Valuation of Meta
In the IFB Equity Model, the company’s historical financials are input which drive the operating and profitability ratios that automatically build the financials. Investors can then make a few critical assumptions, such as the cost of capital of 9.7%, conservative short and long-term growth rates of 3% and 3%, respectively, and using the 3-year average for cost of sales (19.1%) and selling, general and administrative expenses (SG&A, 45.6%). These 3 year averages are lower than the TTM 19.7% and 50.6% respective figures so this already reflects a slight normalization in expenses from some of the headcount cuts which have already taken place at the company.
Later we will run through a sensitivity analysis where we change the key growth and expense assumptions. The same forward inputs are used for each different calculation methodology which will be discussed in detail next.
In addition to the below valuation highlights, looking out at the forecasted financial statements in the IFB Equity Model, we can get a sense of what the business needs to look like in the future in order for our valuation to hold. In the case of Facebook, we can look out 10 years in the forecasted financial statements to see that we are assuming dividends and share buybacks totaling $30.6 billion at that time compared to cash flow from operations of $68.9 billion. Facebook’s free cash flows can handle this return to shareholders while still spending $102.7 billion on cost of services (19.2% of revenue) and SG&A (45.6% of revenue) at that time.
Discounted Cash Flow: Valuing the free cash flows of Facebook in a discounted cash flow (DCF) approach indicates a $219.89 price per share, which creates a 97.3% margin of safety. In such a valuation, we are taking the cash flow from operations and adjusting for capital expenditures. The largest assumptions feeding into this are the conservative 3% short-term and long-term revenue growth as well as the past 3 year average expense figures discussed earlier.
Gordon Growth Model: With an implied price of $171.04, the Gordon Growth Model (GGM) is close to our average valuation across all methods. Facebook does not currently pay a dividend and only started material share repurchases in the past year (now materially higher than stock-based compensation) so this model had a few assumptions built in. Our GGM starts with a $0.60 dividend rate per share (to grow at 20% short-term) and also included the net share repurchase above stock-based compensation. As always, a sanity check on these assumptions going into the model is critical. For 2023, these inputs are forecasted to be a combined $7.90 per share being returned to shareholders, implying a healthy combined 60% payout ratio.
The GGM valuation is a spin on the classic dividend discount model (DDM), taking the dividend and net share repurchases from the models forecast and then valuing the company based on the discounted cost of capital and growth rates. Because the model is using a short-term 20% growth rate as the dividend ramps up combined with a 3% long-term growth rate, this type of DDM is also referred to as a two-stage growth model or H-Model.
Trailing P/E Multiple: Stepping into the “Justified” multiples valuation approach, we start with the trailing P/E multiple which takes the latest earnings and then multiplies it by a “justified” P/E ratio which calculates out to 9.4x for Facebook. The justified P/E ratio is calculated by taking Facebook’s 60.8% payout ratio (through net share repurchases over the past 3 years) put forward for a year’s worth of growth at our 3% long-term growth rate, then divides this by the 9.7% cost of equity less the 3% growth rate.
Leading P/E Multiple: The justified leading P/E valuation is very similar to the trailing but instead multiplies next year’s forwards earnings by the justified leading P/E which in turn does not add growth as it is already taken into account by using next year’s earnings. Facebook’s justified leading P/E ratio is 9.1 that next year’s forecasted earnings will be multiplied by.
Price-to-Book: The justified price-to-book valuation is one for my favorites due to the fundamental comparisons between return on equity (ROE) and the cost of equity (also referred to as the required return on equity). Facebook deserves to trade at 3.05x price-to-book because their return on equity of 23.2% is far higher than their 9.7% cost of capital. Given Facebook’s forecasted $147.5 billion book value of equity, this 3.05x justified P/B implies a valuation of $157.26 per share.
Residual Income Valuation: Facebook’s valuation using the residual income method comes out to $100.15 per share. This valuation method is done by taking the forecasted earnings of the company in any given year and then subtracting an “equity charge” based on the book value of equity and the cost of capital. After subtracting this equity charge off earnings, investors are then left with the residual income with can be discounted back and added to the current book value of equity.

Sensitivity Analysis
There are numerous ways we can change the IFB Equity Model. From changing discount rates, to growth rates, or overriding the historical averages being used in various margin and turnover figures, there are almost countless combinations of scenario’s that could be priced out. Given the adjustment happening at the company from a growth to mature stage in its business lifecycle, the most sensitive variables to its valuation will be revenue growth and expense management.
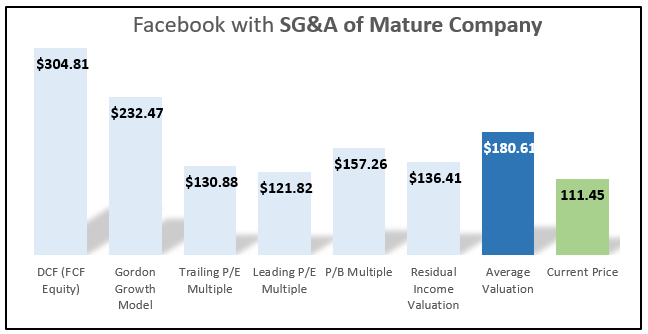
In our first sensitivity analysis, we keep growth the same but take the average SG&A expenses to be in line with Microsoft, which is a mature technology company and arguably more complex and dynamic than Facebook (or Meta). Over the past 3 years, Microsoft had average SG&A of 29.9% of revenue as we saw in our recent valuation of Microsoft. If Microsoft can accomplish this expense management, Meta should be able to do the same. As mentioned earlier, the company has already started to move in the right direction with the recent job cuts.
Adjusting Meta’s 45.6% SG&A down 5% over each of the next 3 years until it stabilizes at 30%, this takes Meta’s average valuation across our six methods to $180.21. This shows what disciplined expense management from a mature company could accomplish for Meta shareholders.
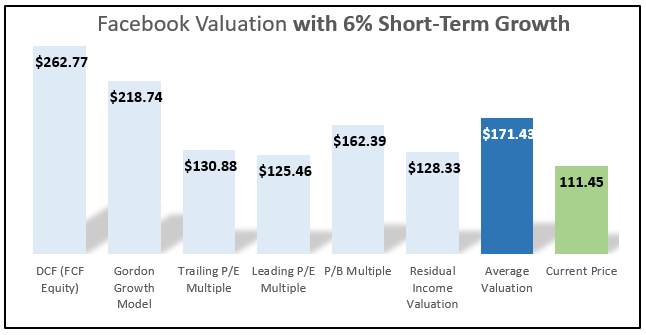
As we started our valuation with a conservative 3% short-term growth rate, let’s also explore what happens to our valuation if we raise growth over the next 10 years to 6%. This higher growth rate is not out of line given the company has growth revenues at an average rate of 31.3% over the past 5 years as mentioned earlier. As can be seen below, under this more aggressive valuation scenario, Facebook’s valuation rises to $171.43, leaving it looking 53.8% undervalued.
Sensitivity analysis is always important to understand the drivers of the valuation and how things can change. In our third sensitivity scenario, we will look to the downside and see what happens if short-term growth is 0% instead of 3%. As mentioned earlier, Facebook’s Q3 revenues grew only 2% in constant currency terms YoY and prices per ad actually fell 18% but were offset by 17% higher ad impressions. This analysis conservatively looks at the valuation if business continues to struggle and results in a $133.50 average valuation and 19.8% margin of safety. With the IFB Equity Model, investors can build in their own assumptions and conduct their own sensitivity analysis.

Risks
Facebook had a first mover advantage in the social media industry which they were able to take advantage of to grow their user base to the market leading 2.96 billion average monthly users mentioned earlier. This platform growth has led to the name Meta. However, there are still independent competitors in the space from the names such as TikTok, Snapchat, and LinkedIn as well as the potential for new platforms to gain traction at any time. On the messaging platform side, there are dozens of competitors, not to mention plain old text messaging. Failure to stay current and attract new users as consumers age and rollover is the forefront risk in my opinion. Investors should carefully watch user statistics.
Regulatory concerns are also a risk; both from compliance for free speech/fake news but also from anti-trust laws hampering the company’s growth. Facebook was able to acquire competitors early on in its business lifecycle such as Instagram and WhatsApp, but any further acquisitions of startup competitors would be closely scrutinized and probably blocked by regulators. Going forward, the company needs to maintain the users of its current products and build new platforms internally.
Takeaway
Facebook looks like an interesting buy for long-term investors at this valuation after having fallen 67% from 52-week highs. The company is maturing and its valuation is adjusting; this opens up opportunities for investors to step in with a new value investment thesis. Facebook’s intrinsic value of $150.29 yields a great 34.7% discount to the current share price of $111.45. Value investors should be getting interested in Meta at its current valuation and growth investors should hold on and adjust to the new long-term potential for shareholders.
The IFB Equity Model is one of the many courses and files available on our products page. The model allows users to easily value a company in a fully customizable model using six different techniques which grab data automatically from forecasted 10-year financial statements being built within the 3-statement financial model.
