Updated 1/22/2024
If you ask me, one of the biggest secrets to investors is the way that ETFs can be used to their benefit to increase their gains. Not only the normal ETFs that come to mind like SPY and VOO, but also some others like MTUM that track the MSCI USA Momentum Index. So what do you say, let’s dive in and get those momentum funds at work!
Click to jump to a section:
- What is Momentum Investing?
- Long-Term Momentum Investing
- MTUM vs. S&P 500
- How I Evaluate An ETF
- MTUM Dividends
- MTUM Fees

What is Momentum Investing?
Momentum Investing is a unique strategy where you’re investing in companies that have seen a nice uptick lately in their share price and have positive momentum. Seems pretty simple, right?
Funny enough, many investors haven’t even heard of Momentum Investing!
Gary Antonacci tested this strategy by comparing companies that were in the top ⅓ for momentum and compared them to the bottom ⅓. Turns out that the top ⅓ outperformed the bottom ⅓ by .4% from 2012 back to 1801.
That might not sound like a massive outperformance, but .4% can add up over time! Just look at the magic of compounding. And guess what, I have some data that can show you that .4% is even less than we have seen in recent history!
Truthfully, if we were going to try to become a momentum investor, I would challenge the word “investor” and say that truthfully, we’re more so “traders” when we utilize Momentum Investing. Buying in and out of stocks solely based on what has happened to the share price in recent days is nothing more than speculation, even if data backs it.

Long-Term Momentum Investing
But what if there was a way to invest in momentum long-term? A way that has pretty consistently beaten the stock market? Well guess what…
You’re in luck!
The way that you can do this is by investing in an ETF called MTUM.
Let’s dive in a bit and study the ETF a bit more.
MTUM is an ETF created by iShares that tracks an index composed of large and mid-cap stocks with high momentum. Sounds somewhat similar to an S&P 500 ETF, right?
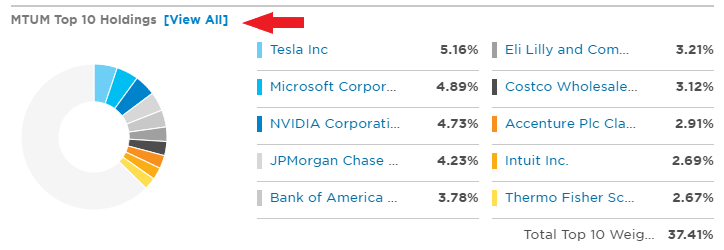
Below are the Top 10 Holdings for MTUM and SPY from ETF.com:
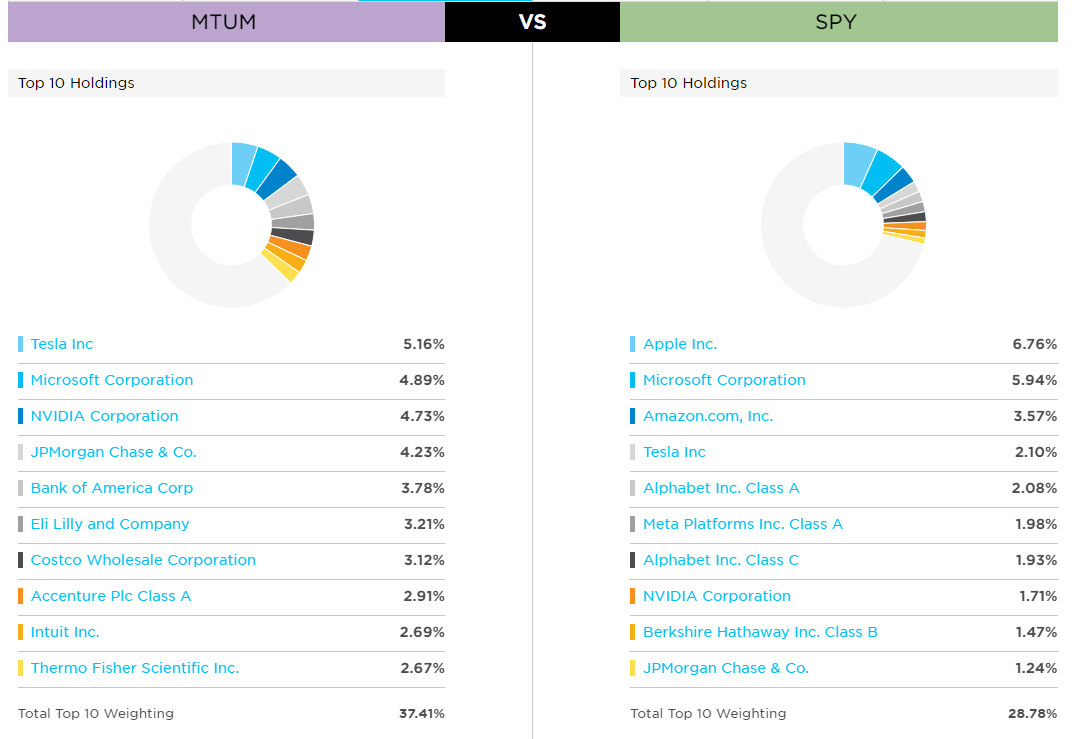
Pretty similar, right? The top 4 for MTUM are all in the Top 10 for SPY.
Now, there are some obvious differences, but all companies are well-known and highly respected, including Costco, one of Charlie Munger’s top stocks as he’s on record saying “Amazon may have more to fear from Costco in terms of retailing than the reverse,” and “Costco will eventually be a huge internet player. People trust it, and they have enormous purchasing power.”
MTUM vs. S&P 500
It’s pretty obvious that Munger is EXTREMELY bullish on Costco. But how has MTUM performed vs. the S&P 500?
Good. Check that – great!
The S&P 500 is seen as the best benchmark for the overall market. If you’re able to consistently beat that, you’re able to consistently beat the market as a whole.
Using one of my favorite websites for simple stock performance comparisons, the Dividend Channel, I can see that MTUM has outperformed SPY since its inception in 2013 by an average of nearly 1% each year.
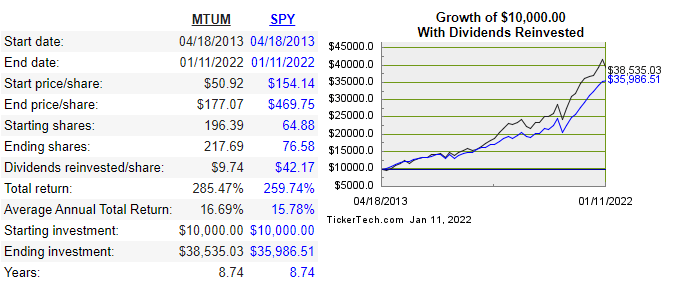
While 1% doesn’t sound like a ton, you can see that a $10K investment would’ve turned into an outperformance of $2,548.52. And if we were to extend that same annual performance over 30 years, the variance between the two ETFs would just be exacerbated:
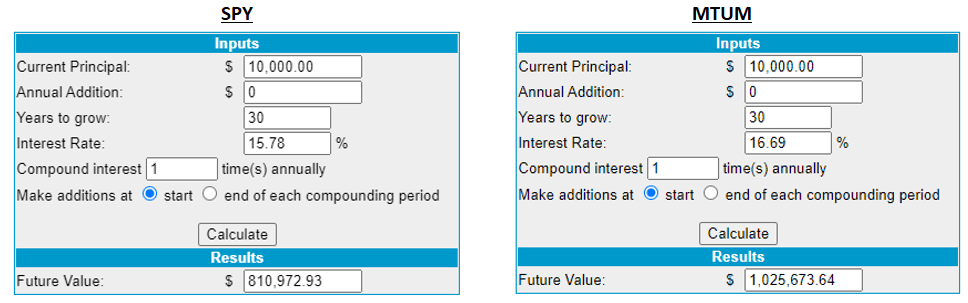
You’d have just over $1 million, a mere $214,701 more than investing in the S&P 500.
Now, I know what the doubters are going to say. The stock market has been on an absolute tear since 2013, so taking the highest-performing stocks and putting more into those names makes sense, and it’s likely not a shock that it’s outperformed the S&P 500.
That is a completely fair point. So, let’s go back even further and see what sort of data there is.
I pulled the oldest data I could find tracking the MSCI USA Momentum Index (April 1994) through April 2021.
When I compare the two indexes, the outcome is pretty eye-opening.
Over the 322 total months of data, the MSCI Momentum index outperformed the S&P 500 for 165 months while the S&P 500 outperformed 157 times. In essence, it’s a complete wash!
However, that doesn’t tell the whole story. One may outperform the other, but we also want to include by how much.
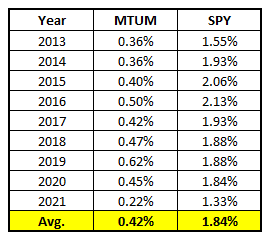
Here are the average monthly performances for each.
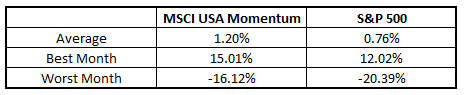
As you can see, the average monthly return was 1.20% for the Momentum Index and .76% for the S&P 500. Both seem like great monthly averages, but that is a massive disparity from one month to another.
Another thing is that the MSCI USA Momentum index has seen stronger highs and lows. So, when the whole market is doing well, the Momentum index soars, and when the whole market drops, the Momentum index stays strong.
That’s a dream for investors.
But let’s be real – we’re not traders. We are investors. We are in this for the long run. So, while looking at the monthly returns is cool, let’s zoom out a bit and look at the annual performance.
This tells a very similar story to the monthly performances.
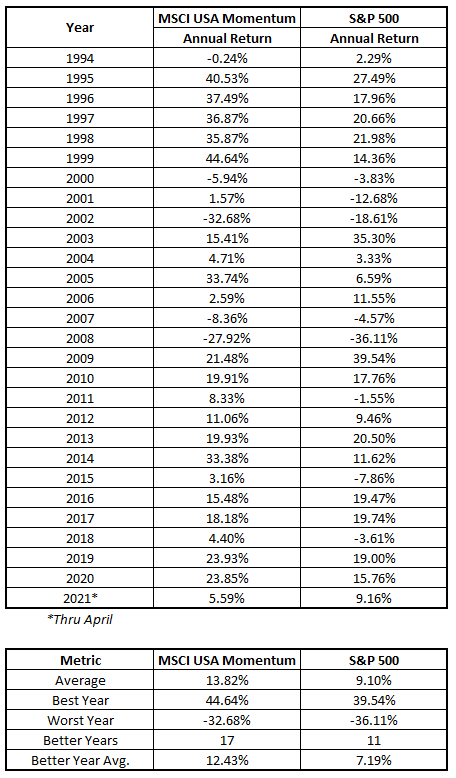
Let me walk you through a few of the key takeaways from it:
- The average outperformance of these indexes is a massive 4.72%. This outperformance is solely in the index’s performance and doesn’t account for dividends.
- Similar to the month comparison, the best year for the MSCI USA Momentum index is higher than the best year for the S&P 500, and the worst month is also higher. Again, this means that you’re getting more upside with less downside. Win-win!
- 17 years out of 28, or 61% of the time, the MSCI USA Momentum Index outperformed the S&P 500.
- On average, when the MSCI USA Momentum Index had a better year, the year had an average outperformance of 12.43%. The S&P would outperform the MSCI USA Momentum Index by an average of 7.19% in the years it performed stronger.
To me, the MSCI USA Momentum index is a clear winner in performance over the S&P 500.
Unfortunately for us (or maybe fortunately), we cannot invest directly into this momentum index just like we cannot invest in SPX, the ticker for the S&P 500. Instead, we must invest in an ETF that mimics the index we’re trying to invest in.
I like to use MTUM as the ETF for the MSCI USA Momentum Index and SPY for the S&P 500 ETF. If you have your own preferred option over SPY such as VOO or VTSAX, you can do that as well, but they’re typically all very similar as they have the same goals – tracking the S&P 500.
How I Evaluate An ETF
Now that we’ve looked at some of the Top 10 holdings of these ETFs and the past returns, there are a few other things that I like to look at. Personally, my top five ETF investing criteria, in no particular order, are as follows:
- Goal of the ETF – we’ve already looked at this. MTUM seeks to track the MSCI USA Momentum Index and SPY seeks to track the S&P 500
- Past Returns – Already completed
- Current Holdings – Partially completed
- Dividend History
- Fees
You see I noted the “Current Holdings” as partially completed because we’ve only looked at the Top 10 holdings. I just like to see “what is under the hood” as Dave has noted in his own ETF investing checklist.
All you do is type in the ETF ticker into ETF.com and scroll through all of the relevant info.
About halfway down the page, you see the Top 10 holdings, and if you click on the “View All” button, you can see all holdings currently in the ETF:
Once you click on that button, a new window pops up and you can scroll through all the other holdings:
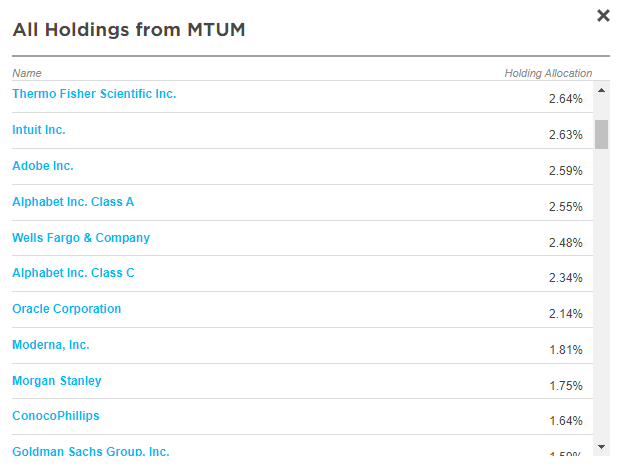
The reason I like to do this is to see if I am familiar with all of the companies. If there’s a large holding in a company that I’m unfamiliar with, then I might take 5-10 minutes to try to understand that company a bit more. It may even become a company I invest in individually because, well, I am also an individual stock picker, you know!
MTUM Dividends
Both ETFs will pay you quarterly dividends but truthfully, I was shocked to see the results between the two ETFs. The yield on SPY is significantly higher than the yield on MTUM. Below is every dividend that’s been paid out since MTUM’s inception in 2013:
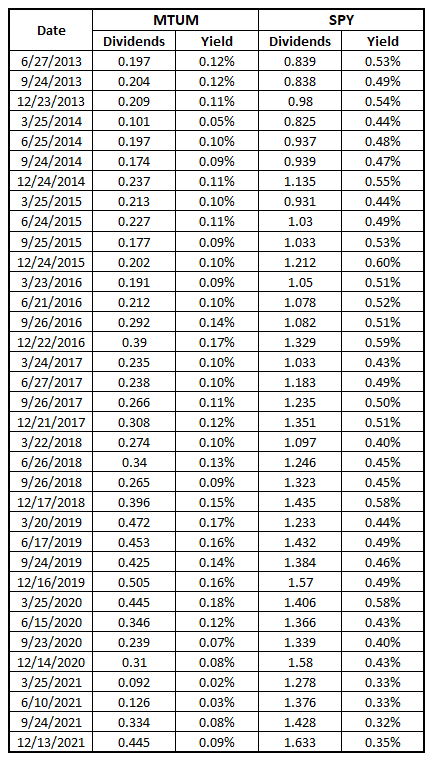
Just by eyeballing you can see that the yield is about 4x more for SPY every time a dividend is paid. That’s insane seeing that so many of the companies are similar! Take a look at the dividend performance on an annual basis:
More of the same – SPY is a significantly better dividend play. So, is this concerning? Truthfully, no, I don’t think so. If you’re a dividend investor looking for yield, then you’re likely not going to be investing in a momentum ETF anyway.
A Momentum ETF takes advantage of those companies that are high-growth companies that have had major runups and are unlikely to pay a dividend because they’re still in growth mode.
So, does a lesser dividend hurt your performance? 100%. But that doesn’t mean it’s a “bad” thing as long as the total return for the ETF is still greater.
MTUM Fees
The last piece of the pie that we need to look at is the fees. Want to guess where we find this? You’re right – ETF.com!
This information is listed near the top of the page on ETF.com. While many people call them “fees,” it also could be called “expense ratio” but it’s all the same – you’re being charged to have someone manage the ETF. Below is the expense ratio for MTUM:
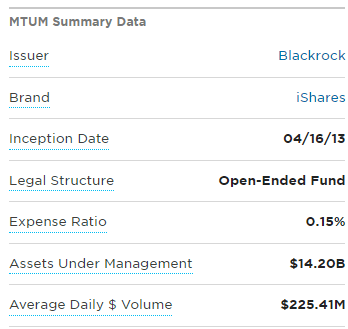
.15% is pretty dang good, especially for an ETF that’s a bit more of a “one-off” than a typical S&P 500 ETF. So, let’s take a look at SPY:
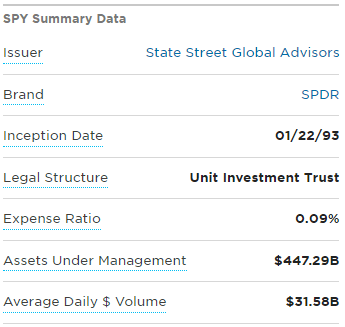
.09%! That’s really low. Both of these ETFs pass with flying colors when it comes to the expense ratio/fee comparison.
Investor Takeaway
So, our analysis is now complete – what ETF do we want to invest in? To get an idea of the true return, we want to take the index return + dividend yield – fees, as shown below:
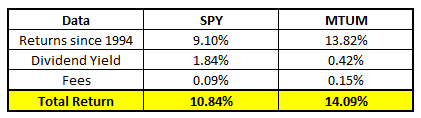
So, the total return of SPY is 3.25% less than MTUM. Don’t get me wrong, 10.84% is still a very nice return for anyone to get in any year, but MTUM has shown that you’re more likely to get higher highs and higher lows over the last 27 years. That’s an extremely sizeable sample size and one that’s “hole proof” for all you hole pokers out there.
“Andy, who cares? We’re talking about 3.25%. That’s not that big of a deal.”
Oh, is it not? If you were to max out your Roth IRA with $6000/year, you’d have literally double by investing in MTUM than if you’d invested in SPY:

Now, again – I really want to emphasize that these are solely historical returns and that anything can happen in the future. For all we know, MTUM could be the worst investment of all time, but in my eyes, there is 27 years of data with the MSCI USA Momentum index that tells us otherwise.
Skeptical? No worries – take a look at one of the other 7 ETFs that Andrew has reviewed or just skip this altogether and pick stocks with the Sather Research eLetter!
