Moody’s Corporation (MCO) announced results for the first quarter of 2020 on April 30, 2020. The following report is a summary of those results for Moody’s and will not attempt to offer any opinions on those results. Only the numbers and facts from the quarterly 10Q report are presented; if you would like more detail, please follow the link below.
Moody’s Corporation 10Q Report for First-Quarter 2020
First Quarter Financial Highlights:
All numbers quoted below will reference comparison to the previous year’s quarter of 2019.
- Moody’s Corporation reported first-quarter revenue of $1.3 billion, which was an increase of $13%.
- Moody’s Investor Service segment reported revenue of $794 million, an increase of 19%; Moody’s Analytics segment reported revenue of $496 million, an increase of 5%. All of which was excluding acquisition and divestitures was up 5%.
- Moody’s reported first-quarter diluted earnings per share of $2.57, which was up 33%, with adjusted diluted earnings per share of $2.73, which was up 32%.
- Moody’s also offered guidance on earnings for the year in the range of $7.25 to $7.80 on diluted EPS, with adjustments expected due to Covid-19.
Selected Financial Data at Quarter End:
- Share Price – $211.50
- Market Cap – $40.1 Billion
- Earnings Per Share – $2.57
- P/E Ratio – 34.13
- Enterprise Value – $56.91 Billion
- P/B Ratio – 89.61
- Return on Equity – 326.19
- Return on Assets – 18.10
- Return on Invested Capital – 24.23
- Debt to Equity – 12.61
Segment Financial Results
Moody’s Investors Services (MIS)
Revenue for the MIS segment for the first quarter was $794 million, an increase of 19%, which was a record for the segment. Foreign currency translation negatively impacted the revenue by 1% for the segment, with the adjusted operating margin of 60.5% for the quarter.
Revenue from corporate finance was up 28% for a total of $453 million. The increase reflected record investment-grade supply in March as companies looked to strengthen their balance sheets with the upcoming uncertainty of Covid-19. By contrast, leveraged finance issuers were active earlier in the quarter when the spreads were more stable, before the effects of Covid-19.
Structured finance revenue was down 5%, at $96 million, which was caused by declines in US and EMEA collateralized loan obligation issuances due to Covid-19 reactions.
Revenue for financial institutions increased to $125 million, up 8% from the previous year’s quarter. The increases reflected financial institutions such as banks and insurance companies increasing their reserves to strengthen their balance sheets. All of which was offset by declines from European banks and insurance companies in their issuances from the previous year.
Public, project, and infrastructure finance reported revenues of $109 million, which was up 17%.
Moody’s Analytics (MA)
MA reported revenues of $496 million, which was an increase of 5%, with foreign currency translation negatively impacting the results by 1%. Organic MA revenue increased by 9% for a total of $484 million, with an adjusted operating margin of 29.3%. The divestiture of Moody’s Analytics Knowledge Service (MAKS) was not included in the results for the quarter.
Research, Data, and Analytics (RD&A) reported revenue of $358 million, which was an increase of 16%, with organic RD&A revenue up 9% or $335 million. The results were excluding the reclassification of Moody’s Analytic Learnings Solution (MALS) and the recent acquisitions of Regulatory DataCorp and ABS Suite. Moody’s attributed the increases to strong renewals, and new sales of credit research and data feeds.
Enterprise Risk Solutions (ERS) reported revenues of $138 million, which were up 13%, with organic ERS revenues of $134 million, an increase of 10%. All of which excluded the acquisition of RiskFirst. Moody’s attributed the increases to strong demand for IFRS17 compliance products, and loan origination solutions along with credit assessments.
First-Quarter Operating Expenses and Operating Income
Moody’s Corporation’s operating expenses totaled $698 million, up 3% from the prior year’s quarter. The expenses were controlled by expense management and lower incentive compensation accruals. All of this was offset by higher estimates of bad debt reserves in light of the Covid-19 pandemic, with foreign currency negatively impacting the results by 1%.
Reported operating income of $592 million for the quarter, which was an increase of 28%, with adjusted operating income of $694 million, up 25%—all which excluded impacts from the divestiture of MAKS. Moody’s operating margins were 45.9%, with an adjusted operating margin of 50.3%.
Moody’s effective tax rate for the quarter was 13.7%, up from 9.2% in the previous year’s quarter.
Capital Allocation and Liquidity
Capital Returned to Shareholders
During the quarter Moody’s repurchased 1.1 million shares for a total cost of $253 million, with an average share price cost of $236.67. In addition, they also issued 0.9 million shares as part of the employee stock-compensation plan. Moody’s also returned $105 million in common stock dividends during the quarter, but Moody’s also announced the suspension of the share repurchases.
In April 2020, Moody’s announced the regular quarterly dividend of $0.56 per share of Moody’s common stock, which will be payable to shareholders of record as of May 20, 2020.
Sources of Capital and Cash Flow Generation
Moody’s, at quarter-end, had $6.8 billion in outstanding debt and an additional $1 billion in a credit facility that has not been drawn on. Total cash, cash equivalents, and short-term investments for the quarter totaled $2.2 billion, an increase from $1.9 billion in the fourth quarter of 2019.
Moody’s reported cash flow from operations of $345 million, and free cash flow of $324 million.
Valuation
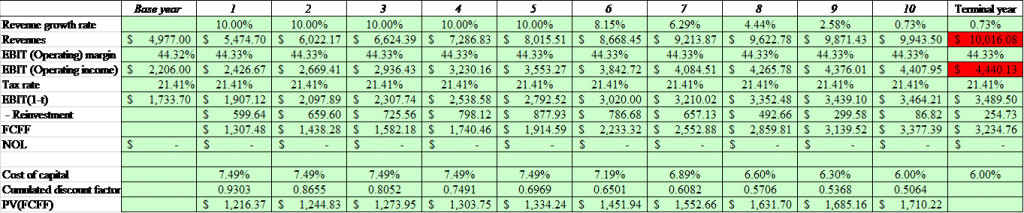
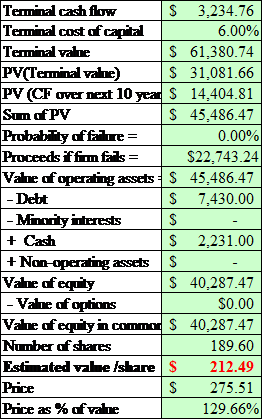
The following valuation is in the form of a discounted cash flow model. The results are not intended to be a price target for acquisition or sale, rather an exercise to show what the value of Moody’s might be at the end of the first-quarter 2020. I will include all of my assumptions for you to assess your value from these calculations. The numbers used to find the intrinsic value came from the trailing-twelve-month numbers or TTM so you can follow along with the inputs.
Free Cash Flow growth rate: 10%
Discount Rate: 7.49%
Terminal Rate: 0.73%
Comparable discount rates
6.49% – $227.27
7.49% – $212.49
8.49% – $198.72
Final Thoughts
With that, we wrap up our summary of Moody’s Corporation’s first-quarter 2020 results. The summary to meant to be used as an educational tool to summarize the financial results; it is not meant as financial advice or guidance or as a recommendation to buy or sell any of the above company’s stock.
Thank you as always for reading, and until next time.
Take care, and be safe out there,
Dave
