Real estate investment trusts, or REITs own, manage, and finance income-producing properties. By law, these businesses must distribute at least 90% of their profits to shareholders as dividends. Valuing REITs is a difficult proposition because of the structure of the business and the fact that shareholders receive the majority of the free cash in the form of dividends.
To the rescue comes the net asset value model, which we can use to determine the value of the REIT based on its financials and additional inputs.
Tools such as price to earnings and price to book are not useful when valuing REITs because of the structure of the business, mainly because all of the assets are in real estate. Therefore, depreciation of those assets is a real cost. All of this makes earnings for a REIT not representative of the company’s value.
In today’s post, we will learn:
- What is a Net Asset Value Model?
- Steps to Calculate the Net Asset Value Model
- Practical Examples of the NAV with Real Companies
Let’s dive in and learn more about using the net asset value model to find the intrinsic value of REITs.
What is the Net Asset Value Model?
One of the most important questions when considering REITs is whether the businesses remain fairly priced. REITs present special considerations we must consider when attempting to value them.

Because REITs throw off rental income from their investments in different properties, they remain similar to bonds, which are easier to value because of the fixed income of the dividends or coupons.
The difficulty with REITs is the changing values of the company’s real estate and valuing that property and the potential growth of the revenues or rental income.
The net asset value model, or NAV, estimates the current market value of the REITs properties, net of other non-real estate assets and liabilities.
We must consider the use of NAV over the book value of the assets because the book value doesn’t account for the changes in the value of the underlying land and properties built on that land. Nor does it take into account the future earnings potential of the properties or the REIT assets.
We use the NAV as an attempt to bypass book value in favor of providing a more accurate value of the REIT holdings’ market value.
The usual metrics, such as the P/E and P/B, are GAAP numbers, but when working with REITs, we must stray away from those numbers and use non-GAAP figures to assess the value of the REIT.
The most common figures we use are the funds from operations (FFO) or the adjusted funds from operations (AFFO), of which you can find more information here:
REIT Valuation, Methods, Metrics, and Analysis
To calculate the net asset value of the REIT, we must use the following model:
Net Asset Value = Net Operating Income x Cap Rate / Mortgage Liabilities
To calculate the NAV, we must capitalize the operating income based on market rates. A cap rate for the present market values of investments is defined and then used to divide a property’s operating income, which results in the property’s estimated market value. Once we have that value, we subtract out any mortgage liabilities to arrive at the net asset value of the property.
Steps to Calculate the Net Asset Value Model
We use several calculations in estimating a REIT’s NAV, but the basic concept remains simple: estimate the current market of the REIT’s portfolio, add any other intangible assets, subtract all the mortgage-related liabilities, and then divide the NAV by the outstanding shares.
We have four major steps to calculating the NAV of a REIT; below, we will walk through each step and outline where we can find each data point.
Step 1: Finding the “Cash” NOI
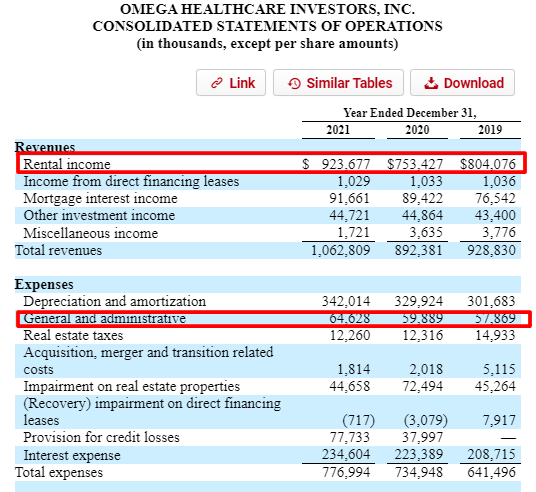
The first step to calculating the NAV of any REIT is to determine the NOI, or net operating income, for the REIT, which we find by looking at the income statement for several items:
- Rental income
- General and administrative
We ignore the other incomes and expenses because those line items don’t directly relate to the company’s assets. For example, income from interest is not a direct income from the real estate purchase.
When working with REITs that deal with shorter leases, such as apartments, retail, and office spaces, we can use the numbers directly from the income statement.
However, GAAP accounting gets in the way when working with REITs that operate longer leases, such as medical buildings. Longer-term leases tend to have clauses that allow for graduated rental increases, either fixed or tied to inflation. These rent increases can happen annually or every few years, depending on the lease agreements.
GAAP accounting requires that rental revenue be reported on the income statement by the average annual rent over the entire lease term. This means that rental revenue could be overstated in the early years and understated later in the lease.
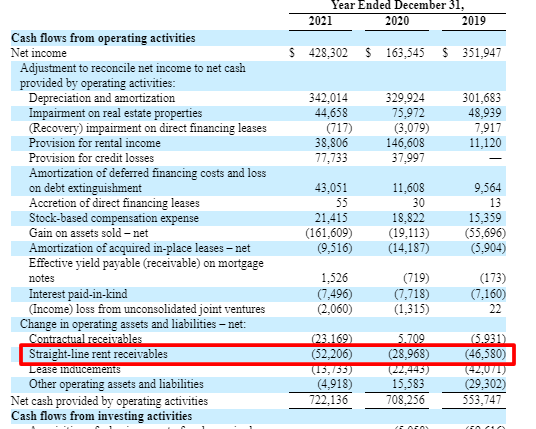
To adjust to that GAAP accounting rule, we must adjust the rents straight-line, and all REITs must disclose that information.
In the case of Omega Healthcare Investors, I use the “Ctrl-F” function to search for “straight-line rental revenues,” and we can see that the company breaks out the straight-line rent over the next eight years.
If you run across a REIT that doesn’t provide you with the numbers relating to straight-line rents or any adjustments to the numbers, don’t get discouraged, you can use the NOI from the rental revenues and costs associated with those rents and roll with those numbers.
Therefore, our net operating income equals:
- Rental income $923,677
- General and administrative $64,628
- Straight-line rent $52,206
NOI = $923,677 – $64,628 – $52,206
NOI = $806,843
Step 2: Adjust the cash NOI for adjustments or placements coming online during the quarter.
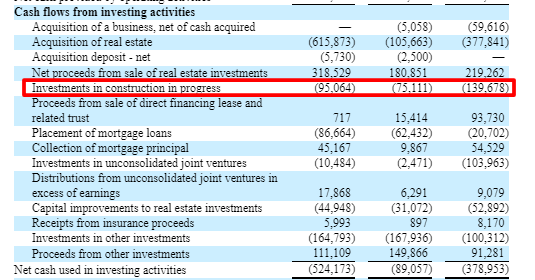
Next, we need to adjust our NOI by any acquisitions made during the year, construction in progress, or any purchases that might have come online during the year. We make these adjustments because they are direct costs to the company’s cash relating to the real estate portfolio.
Omega Health has substantial cash outflows, but that is not always the case, as we will see in the next section as we examine other REITs.
In the case of OHI, I will use the numbers from the cash flow statement to locate our data.
Taking the numbers from above, we add them up and then subtract them from our NOI.
- Investments in construction in progress – $95,064
NOI = $806,843 + $95,064
NOI = $902,447
Step 3: Divide the Cash NOI by the Cap Rate for the REIT
In this step, we continue looking for the fair value of the assets of the REIT that a buyer would pay for those assets, taking into consideration any debt or preferred shares.
In the actual transaction, the buyer would analyze each property and determine the present value of the expected cash flows or rents from that portfolio over five to ten years.
A short-hand way of doing this is to assume the rate with a capitalization rate.
The cap, or capitalization, rate measures the expected unlevered return on the REIT assets. Think of it this way: the cap rate equals the P/E ratio upside down, in that the price equals the fair market value of the assets, and the earnings are the cash NOI of the REIT.
Cap rates are difficult to calculate, and there are several methods to determine the cap rate of a REIT; some REITs are generous and provide the rate for us by using our favorite CTRL-F function and searching for “capitalization rates.” The other method is to use Google machine and search for the cap rates on sites such as REIT.com or search for the REIT sector you are valuing.
In our case for OHI, I googled the healthcare sector for REITs and found the cap rate of 8.5%
Now to find the market value of the NOI, we divide the NOI by the cap rate.
Fair market value = NOI / Cap rate
Fair Market Value = $902,447 / 8.5%
Fair market value = $10,617,024
Step 4: Adjust Fair Market Value for Other Investments and Financing
In the final step, we adjust the fair market value to include values for assets that are not generating NOI, and then we subtract total Debt and preferred stock outstanding.
Using the balance sheet, we find tangible assets such as cash and restricted cash, accounts receivable, and prepaid expenses. We do not include items such as deferred leasing, financing costs, or deferred rents. Also, add any assets held under the sale listed on the balance sheet.
Next, we subtract any debt and preferred stock to arrive at our net asset value or NAV.
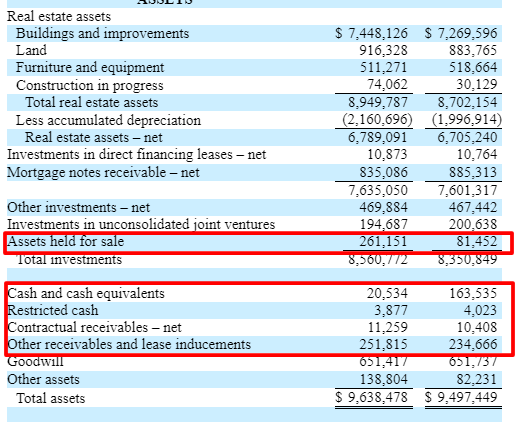
- Assets held for sale – $261,551
- Cash and equivalents – $20,534
- Restricted cash – $3,877
- Contractual receivables – $11,259
- Other receivables – $251,815
All of which totals $549,036
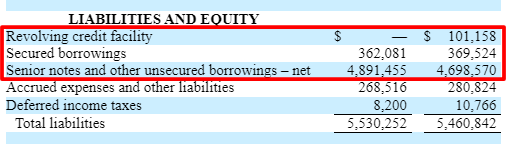
All of which totals $5,253,536
And now that we have all our numbers, let’s add and subtract them from the fair value.
NAV = $10,617,024 + $549,036 – $5,253,536
NAV = $5,912,524
Then to arrive at our per-share value, we divide our above NAV by the outstanding shares and find our NAV per share.
NAV = $5,912,524 / 237,500
NAV = $24.89
Ok, now that we see how to break that down, why don’t we put this to work with some other real companies to determine the NAV of a few other REITs.
Here is a Net Asset Value calculator for you to use to make these calculations easier. Please feel free to adjust as you see fit.
Practical Examples of the NAV Model with Real Companies
As we work through our next example, I will pull all the numbers together, and then we will walk through each example so you can see how we calculate the NAV for each REIT.

For our first example, I would like to analyze Federal Realty Trust (FRT).
Step 1: Rental Revenues – $951,224
Expenses – $160,556
NOI = 951,224 – 160,556 = $790,668
Step 2: Acquisitions made during the year – $368,786
NOI = $790,668 + $368,786 = $1,159,454
Step 3: Fair market value based on cap rate
Cash NOI = $1,159,454
Cap rate = 8.5%
Fair market value = $1,159,454 / 8.5% = $13,640,635
Step 4: Adjustments to the Fair Value
Accounts receivable – $163,145
Cash and other Tangibles – $162,132
Assets HFS – $0
Total Debt – $4,047,547
NAV = $13,640,635 + $562,346 – $4,047,547
NAV = $10,155,434
NAV per share = $10,155,434 / 78,616
NAV per share = $129.18
Ok, let’s do one more, shall we?
I want to analyze Simon Property Group (SPG) next for giggles.
Step 1:
Rental Revenues – $5,116,789
Rental expenses – $30,339
NOI = $5,116,789 – $30,339 = $5,086,450
Step 2:
Straight-line rent = $3,701,991
Investments in construction – $$797,519
Adjusted NOI = $5,086,450 – $3,701,991 + $797,519 = $2,181,978
Step 3:
Cash NOI – $2,181,978
Cap rates – 8.5%
Fair value = $2,181,798 / 8.5% = $25,670,329
Step 4:
Assets = $2,574,601
Liabilities = $25,827,953
NAV = $25,670,329 + $2,574,601 – $25,827,953
NAV = $2,416,977
NAV per share = $2,416,977 / 32,824 shares outstanding
NAV per share = $73.63
Let’s compare all three of our NAV calculations to their current market values.
| NAV | Market Price | MOS % | |
| OHI | $24.87 | $31.66 | 0% |
| FRT | $129.18 | $104.17 | 24% |
| SPG | $73.63 | $116.24 | 0% |
Typically, the NAV trades approximately 15% above or below the NAV of REITs based on the current average cap rates available to investors.
But, after COVID-19, the market is currently pricing most of the REITs down, which accounts for many of them having a value below their market values.
And the basing of the prices is a result of the higher debt loads that many REITs carry and the justified worrying about the ability of many businesses to continue paying the rents.
Most of the sector has seen difficulty with collecting rents, but it varies by a subset of REITs. For example, the healthcare sector has had no trouble collecting its rents, whereas the malls and retail sectors are experiencing much more trouble, all of which highlights the efforts to value any company you want to buy.
Final Thoughts
Many investors make the mistake of investing in REITs without understanding the businesses’ fundamentals and what the companies are worth. Remember that the price we pay matters in the long run.
Valuing a REIT brings a few issues, such as what to do with the Debt of those investments and how to treat the income of REITs. But once you understand how to speak the language of REITs, then valuing the companies becomes much easier.
Using models such as relative valuations based on comparisons with other REITs is ok, but I would rather use a model such as a dividend discount model or the NAV model we analyzed today. The trouble with relative valuations is comparing one company to another and whether the whole sector is overvalued or undervalued. Once you cross that slippery slope, it is hard to determine the company’s true value.
That is why using multiple models to determine your value is always the best strategy to arrive at a range of values. Then you can use your judgment and business acumen to determine what is more likely.
That is going to wrap up our discussion for today.
As always, thank you for taking the time to read this post, and I hope you find something of value on your investing journey.
If I can be of any further assistance, please don’t hesitate to reach out.
Until next time, take care, and be safe out there,
Dave

Dave Ahern
Dave, a self-taught investor, empowers investors to start investing by demystifying the stock market.
