Updated 8/25/2023
Net Debt to EBITDA ratio is a common tool for measuring risk. It’s often listed in company financials. The logic is simple, and the ratio isn’t terribly complex; let’s see how to calculate it ourselves.
In this post, we will cover [Click to skip ahead]:
- How to Calculate Net Debt to EBITDA
- What is a Good Net Debt to EBITDA?
- Downsides to a High Net Debt to EBITDA Ratio
- Debt Analysis: Going Further than Net Debt to EBITDA (Example)
- Average Debt to EBITDA of the S&P 500 – 20 Years
- Average Debt to EBITDA of the S&P 500 – By Industry
Let’s dive in.
How to Calculate Net Debt to EBITDA
To understand this ratio, you first need to understand how each metric above is calculated.
EBITDA stands for Earnings Before Interest, Taxes, Depreciation, and Amortization. For an in-depth breakdown on EBITDA, I’d recommend this introductory post we also have on the site.
Another way to think of EBITDA is as Operating Income with D&A added, which is frequently found in the Consolidated Income Statement and is sourced from revenues in the following way:
Getting to EBITDA
Revenue
-minus (COGs) Cost of Goods
= Gross Profit
-minus (R&D) Research and Development
-minus (SG&A) Selling, General & Administrative
= EBIT
-plus (D&A) Depreciation and Amortization
= EBITDA
Getting to Net Debt
The other side of the Net Debt to EBITDA formula is Net Debt, which is the following formula:
Net Debt = Short Term Debt + Long Term Debt – Cash and Cash Equivalents
You can find the variables for Net Debt in the balance sheet and quickly calculate the final formula from there.
The Formula
The Net Debt to EBITDA formula is:
Net Debt to EBITDA Ratio = Net Debt / EBITDA
What is a Good Net Debt to EBITDA Ratio?
With Net Debt to EBITDA, the lower the ratio, the better.
As the data over the last 5 years suggests, a Net Debt to EBITDA below 2x is good. Having this ratio below 2x would indicate a company with less debt than the average.
You don’t want to see this ratio get too high.
Generally, a Net Debt to EBITDA above 4x or higher is considered risky.
The Usefulness of the Ratio
Another way to think about the Net Debt to EBITDA ratio is that it tells you how many years (roughly) it would take for a company to pay off its debt.
EBITDA more accurately represents a company’s real cash flows (since D&A are non-cash expenses), but also has its limitations/ complications (interest and taxes are real cash flow expenses that are intertwined; in other words, interest reduces tax expense but does require a real cash outlay).
Basically, it’s a decent estimate and a good comparison tool against its history, its competitors, or even the overall market.
Downsides to a High Net Debt to EBITDA Ratio
The thing about long-term debt is that while interest expenses of debt is in the Income Statement, paying off the principal of a debt gets taken out of free cash flows and represents money not available to shareholders.
So when valuing a company based on free cash flows (DCF model), you might want to take Long Term Debt into consideration because it will reduce the company’s potential to return capital.
One way to do this in your DCF model is to differentiate between FCFF (Free Cash Flow to Firm) and FCFE (Free Cash Flow to Equity).
The bottom line is:
The higher Net Debt to EBITDA that a company has, the more payments the company has to make towards its principal to come out of free cash flows.
If this debt level is excessive, it could represent an overvalued company.
Debt Analysis: Going Further than Net Debt to EBITDA (Example)
Simply seeing a company with a high Net Debt to EBITDA ratio and calling it a day can leave out some great companies with growth potential that are actually less risky than they seem.
Let’s take the company Griffon Corporation ($GFF) as a great example of this.
In any company’s 10-k, you can see a detailed break-out of not only what kind of debt the company has, and at what interest rate they are paying on, but also what the schedule of those debt payments are.
From $GFF’s latest 10-k, search (Ctrl+f) “Contractual Obligations” (or just “obligations” if your company calls it differently) in order to see their debt repayment schedule:
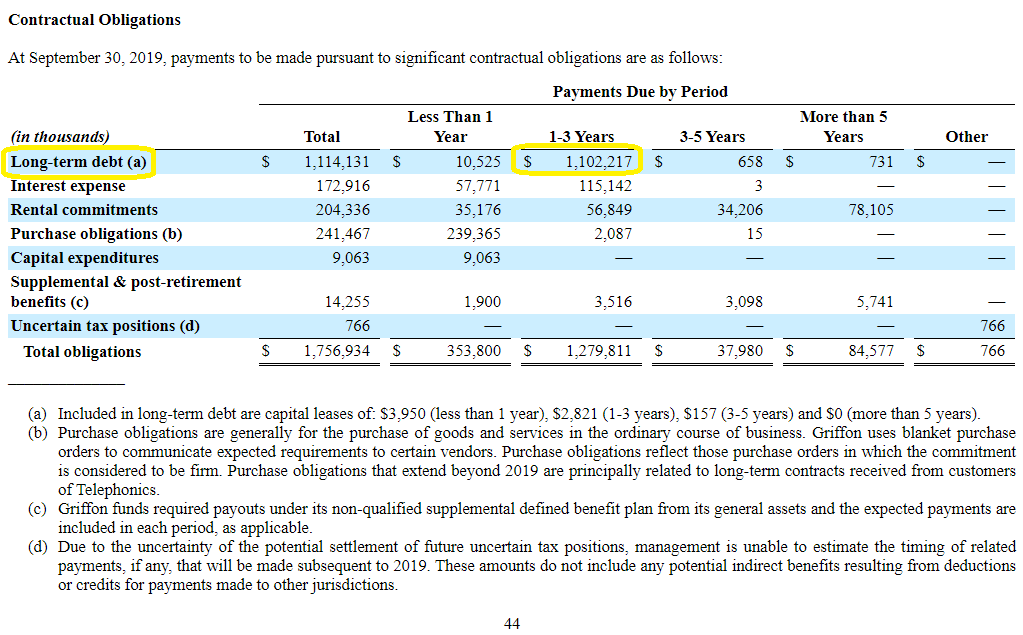
You can see from the Contractual Obligations table that the company has a large debt repayment due ($1.1B), but not until the 1-3 Year mark.
We can get more precise information by searching “debt”, in which case we see this table explaining the various debt instruments in Footnote 10—Notes Payable, Capitalized Leases and Long-Term Debt.
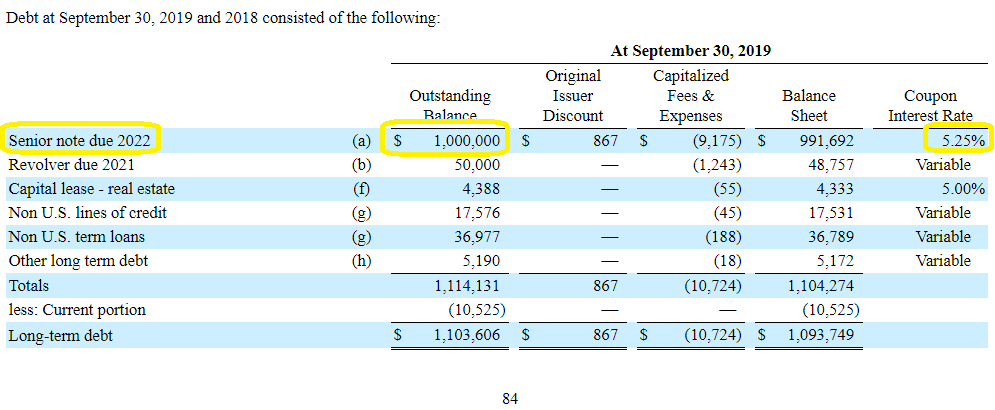
The vast majority of that $1.1B due in 1-3 years consists of the Senior Note due 2022 with an Outstanding Balance of $1B and a Coupon Interest Rate of 5.25%.
Knowing that the company currently has a Net Debt to EBITDA of 4.8x (self-reported by the company using adjusted EBITDA), and earned FCF of around $68 million in 2019, this $1B might start to become a cause for concern for investors and prospective investors, unless the company can successfully refinance that debt.
Turns out, that was precisely what $GFF was able to do.
From following their 8-k’s through 2020, I could see that $GFF was able to refinance the entire $1B principal into a Senior Note due 2028. You can see the difference in their latest 10-q:
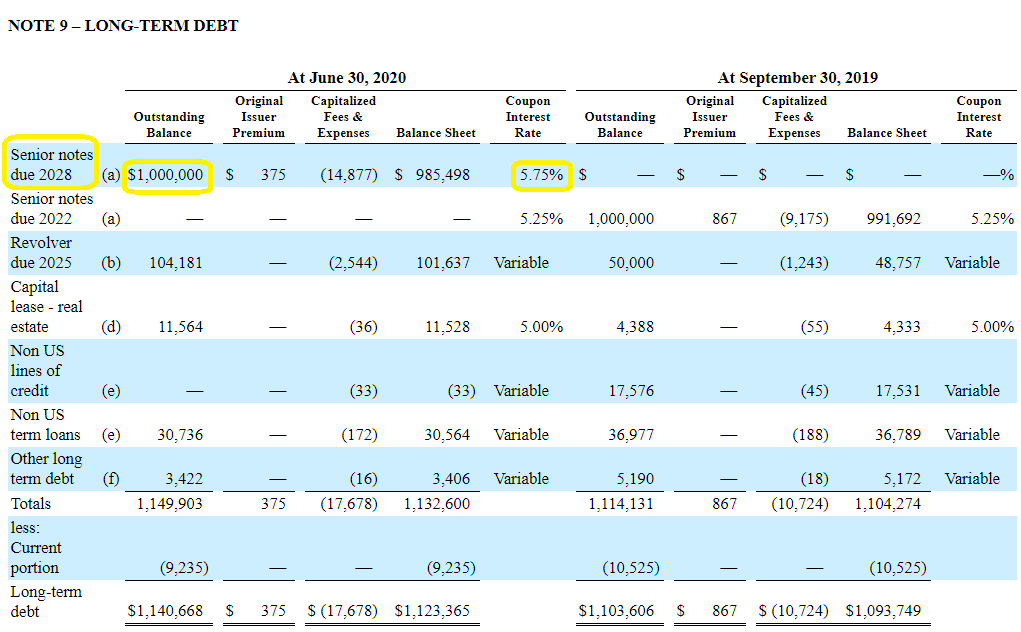
Getting more clarity on the Senior Note by scrolling down:
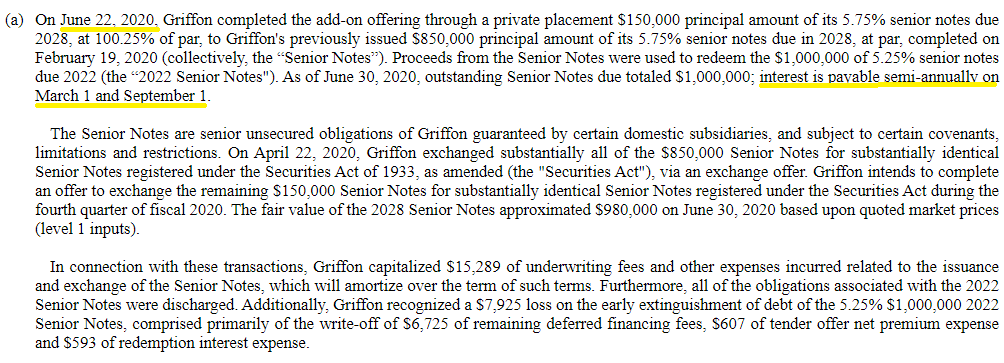
Clicking through into the 8-k filed by the company on June 22, 2020, we see terms of repayment (since the new 10-k reflecting this refinance hadn’t been released yet):
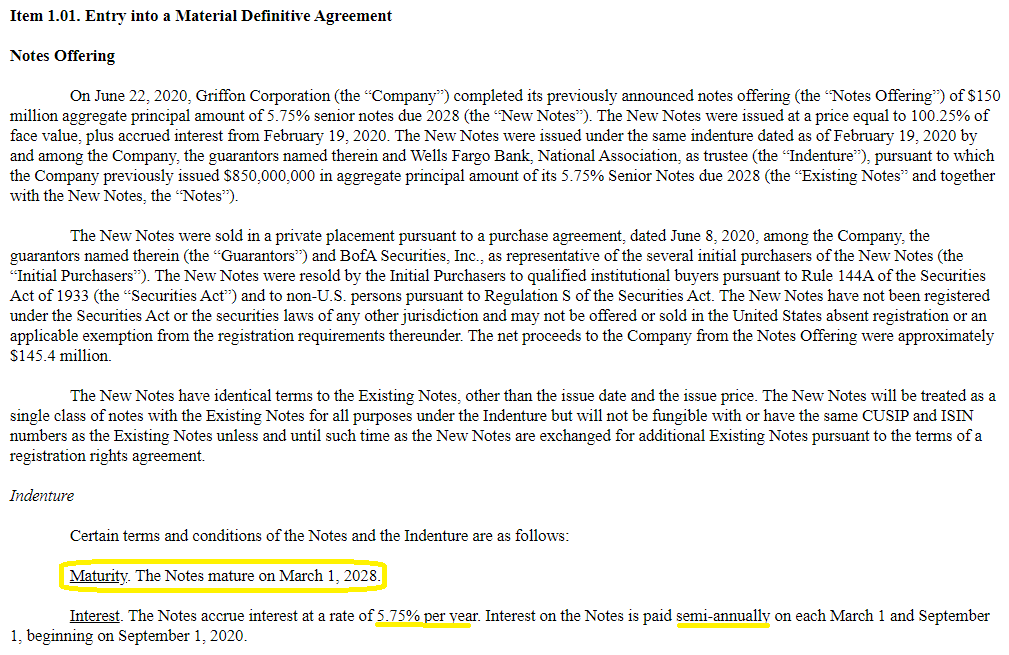
Notice that after this refinance, the Net Debt to EBITDA for $GFF hasn’t changed, but the riskiness of investing in this company has reduced greatly now.
Since this Senior Note is on a bullet maturity (meaning only interest payments are made, and the entire principal is paid in full in 2028), the company has a long ramp ahead (8 years!) of free cash flow usage towards growth and shareholder yield.
Now all of a sudden, the company’s Net Debt to EBITDA of 4.8x, doesn’t seem so bad—especially when you consider that as long as the company maintains high growth of EBITDA, their future Net Debt to EBITDA ratio will decrease and make securing a new Senior Note much easier.
Disclaimer: I sold out of my $GFF position in February 2022, shortly after this section was originally written.
Average LT Debt to EBITDA [S&P 500] – 20 Years of Historical Data
To create this dataset, I simply took the current S&P 500 list of companies in 2022 (as of 7-18-23), and 2020 (as of 10-30-20) and inputted their EBITDA and Long Term Debt into a spreadsheet. Then I took the median value of every company, excluding the values where Long Term Debt wasn’t reported accurately.
Here are the results:
| YEAR | LT DEBT-TO-EBITDA |
|---|---|
| 2022 | 2.22 |
| 2021 | 2.20 |
| 2020 | 2.34 |
| 2019 | 2.29 |
| 2018 | 2.43 |
| 2017 | 2.35 |
| 2016 | 2.25 |
| 2015 | 1.95 |
| 2014 | 1.88 |
| 2013 | 1.85 |
| 2012 | 1.77 |
| 2011 | 1.72 |
| 2010 | 1.75 |
| 2009 | 1.63 |
| 2008 | 1.45 |
| 2007 | 1.38 |
| 2006 | 1.37 |
| 2005 | 1.54 |
| 2004 | 1.66 |
| 2003 | 1.75 |
| 2002 | 1.72 |
| 2001 | 1.46 |
We can see that the Debt to EBITDA is steadily increasing, but we also should know that this has happened alongside falling interest rates (for 40+ years!), and amidst record low interest rates since the pandemic of 2020.
Remembering that the Long Term Debt value without context can be misconstrued, it’s likely that many of the companies in the S&P 500 have been taking advantage of the lower interest rates to lock in those favorable terms while deploying that capital for future growth in their businesses.
Also, the actual Net Debt to EBITDA ratios might be lower (or slightly higher!) due to this dataset solely looking at Long Term Debt rather than Net Debt (which includes cash and short-term debt).
Average LT Debt to EBITDA of the S&P 500 – By Industry [The 11 Sectors]
I took the dataset one step further to segment the Debt to EBITDA ratios by major sector. **adjusted to exclude negative values.
Please understand that since each column takes the average rather than the median value for each industry, there are a few data points where the reported value could be misrepresented due to an extreme value heavily biasing the result.
| SECTOR | 2022 AVG | 2010 AVG | 2001 AVG |
|---|---|---|---|
| Communication Services | 2.56 | 2.57 | 0.51 |
| Consumer Discretionary | 3.84 | 0.34 | 1.41 |
| Consumer Staples | 2.43 | 1.52 | 1.25 |
| Energy | 1.52 | 1.46 | 1.17 |
| Financials | 3.61 | 27.39 | 2.95 |
| Health Care | 2.1 | 2.20 | 0.34 |
| Industrials | 2.27 | 2.20 | 1.56 |
| Information Technology | 1.62 | 8.78 | -0.44 |
| Materials | 2.13 | 2.36 | 0.98 |
| Real Estate | 5.33 | 7.30 | 5.21 |
| Utilities | 5.17 | 3.62 | 2.77 |
| Grand Total | 2.83 | 6.46 | 1.50 |
We can see that the Debt to EBITDA ratio can vary wildly from industry to industry, which makes sense because some industries are much more capital-intensive than others.
Additionally, each of the businesses is on its own path in the life cycle of its industry, which affects the cost of capital for those businesses depending on many outside factors—future expected growth, competitiveness and pricing power in a market, and more.

Andrew Sather
Andrew has always believed that average investors have so much potential to build wealth, through the power of patience, a long-term mindset, and compound interest.
