The Netflix product is easy to understand for most investors. Doing an in-depth stock valuation can be much harder. In this post, I will show an example of how to value Netflix so investors can do this now and in the future.

Netflix has a unique business model. It absolutely disrupted the media industry and the way that customers consume content forever.
Even with this fact, we can still estimate a valuation without calling an analysis of its financials impossible.
This post will cover the following [Click to Skip Ahead]:
- Business Overview
- Amortization: The $1 million Question
- Risk #1: Churn
- Risk #2: Industry Dynamics
- Risk #3: Debt
- How to Value Netflix with a DCF
You probably want a deeper understanding of accounting if you truly want to grasp this post. Try reading about depreciation and amortization first if that’s you. I promise it will be well worth your time, especially when you consider how much Netflix has been investing in its own exclusive content, and how that is integral to its future financials.
Business Overview
The vast majority of Netflix’s revenues comes from paid subscriptions to its streaming service. Most of us know about the company’s streaming service. It provides instant access to a vast library of movies and bingeable TV series on any paid customer’s internet-connected device.
This service has been so successful that as of 4/19/2022, Netflix now boasts 221.64 million paid memberships in over 190 countries. In fact, check out these insane growth numbers on their paid memberships (annually):
- 2021: 221,844 [8.9% YOY]
- 2020: 203,663 [22% YOY]
- 2019: 167,090 [20% YOY]
- 2018: 139,259 [26% YOY]
- 2017: 110,644 [24% YOY]
- 2016: 89, 090
To answer the question of Netflix’s stock valuation before going super deep into the accounting weeds (which we will do below), we need to realize that it’s not just subscriber numbers which drive the company’s stock value.
It’s the fact that the company can, and has, significantly improved profitability margins over time through long term investment in content assets.
Since a great TV series or movie only needs to produced once and can provide significant long term value for customers indefinitely, the costs to produce content are less about recurring expenses and more like long term investments.
Really good content can have a very long shelf life—just think about how many people still binge TV shows like Friends or The Office. Original Netflix shows include Stranger Things and Squid Game.
As Netflix spends less on investments in great content, it can vastly expand its profitability, which drives huge bursts of growth to the company’s Earnings and Earnings Per Share. That’s great for valuation.
In fact, that process is already in the works, evidenced by the company’s Operating Margin:
- 2021: 21%
- 2020: 18%
- 2019: 13%
- 2018: 10%
- 2017: 7%
- 2016: 4%
Finally, as customers stay longer with the service, the recurring nature of a subscription business increases the ARPU (Average Revenue Per User), assuming the company can keep churn (subscription cancellations) down. Netflix has also seen nice growth in their ARPU:
- 2021: $11.67
- 2020: $10.91
- 2019: $10.82
- 2018: $10.31
All of this has boosted Operating Margin for the company in the last 5 years and could continue to drive huge gains in EPS in addition to its fantastic revenue growth rates it has seen lately (posting because they are also truly incredible):
Revenue Growth YOY
- 2021: 18.8%
- 2020: 24.0%
- 2019: 27.6%
- 2018: 35.1%
- 2017: 32.4%
- 2016: 30.6%
Amortization: The $1 million Question
The key to answering the Netflix stock valuation question is through analyzing the company’s content assets. If content produced in-house is fully amortized at cost, yet continues to drive new subscribers and retention (think a hit series like Game of Thrones or Netflix-produced Stranger Things), then the company’s balance sheet is likely severely undervaluing these assets.
With enough legacy content assets which drive additional profitability for the company, Netflix could probably continue to increase its operating margin by reducing future content spending and lowering Cost of Revenues (similar to COGs), which increases Gross Margin and flows down to Free Cash Flow.
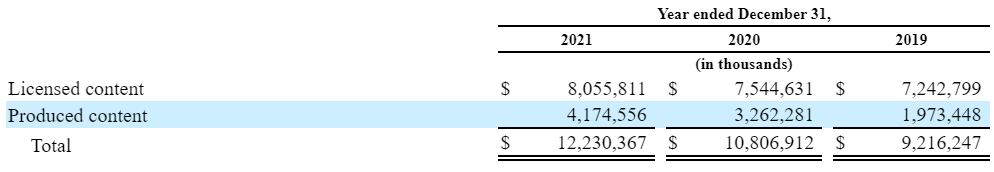
This screenshot shows the balance of Netflix’s content assets between licensed (third-party) and produced (in-house):
We could track amortization of these produced content assets over time; another way to measure this is to monitor ROIC over time.
An invested capital calculation for Netflix is not the same as an average company; we must include content assets as part of Invested Capital. This is because PPE (Plant, Property, and Equipment) doesn’t sufficiently include Netflix’s real capital outlays to maintain and grow profitability. If some content assets fully amortize at cost over time, and these content assets indeed drive retention and new accounts, then the Invested Capital part of ROIC gets held constant while NOPAT (profitability) in the numerator continues to increase, driven by both revenue growth and the expanding margins discussed above.
This could trigger huge potential increases in future ROIC for the company, representing an incredible amount of future capital which can be returned to shareholders through buybacks and dividends, as the company reaches a cash cow status on its blockbuster TV series and movies investments.

The extent that Netflix’s valuation can reflect this long term content asset thesis depends on how effective their in-house content assets can continue to drive retention and customer acquisition, which are major KPIs (Key Performance Indicators) followed by analysts and reported regularly by management.
As (or if) the ROI on legacy in-house assets declines as evidenced by these KPIs, the valuation for Netflix’s stock can compress significantly as the projected incremental improvements in ROIC reverse in the exact opposite direction, compressing margins and reducing top-line growth which inevitably flows down to Free Cash Flows.
Whether these declines happen depends on a myriad of factors, many of which are quantified in Netflix’s 10-k “Risks” section, which we need to analyze (and its influence on valuation) next.
Risk #1: Churn
Competition is fierce in the media and entertainment industry, as major players are fighting for not only market share and customer dollars, but share of customer attention and engagement.
A subscriber who spends more time on the Netflix platform should, in theory, be more likely to continue paying for their subscription, and also respond positively to any future price increases. This assumes, however, that the amount of new content on Netflix is able to satisfy this ideal subscriber’s appetite for new and engaging content, making churn and customer satisfaction one of Netflix’s primary risks.
While great legacy content assets can create a cash cow situation for the company, a complete absence of new investment is likely to reduce customer satisfaction as subscribers run out of content to consume.
In other words, the company can’t rest on its laurels.
Incremental improvements on ROIC is not likely to continue indefinitely, and at some point the company will likely run into a maturation phase on its margins expansion, where a maintenance level of capital outlays will need to be established to satiate subscribers’ appetites.
This maintenance level of capital outlays can be influenced by so many other things—production costs and their trend over time, competing content and its production costs, customer tastes, and many others.
Monitoring a risk like this is not about measuring every single potential factor, but rather watching the trend of content amortization and investment, and subscriber churn over time.
If measurements like these start to embark on a secular downtrend, the valuation of Netflix’s stock is likely to also face a secular downtrend.
Risk #2: Industry Dynamics
What can make analyzing media conglomerates and streaming peers difficult—especially those peers which include the companies who own Disney+ ($DIS), HBO Max ($T), Peacock ($CMCSA) and Paramount+ ($VIAC)— is that competing pressures can additionally persist outside of the customer share of mind competition.
There are many examples of this; let’s just take a few.
Some ways that customers are delivered the Netflix platform are completely out of Netflix’s control.
For example, many of the new smart TVs, such as the Roku, include various apps inside of their ecosystem. Some of these ecosystems choose to highlight Netflix as a default, pre-installed choice for every user.

In the future, this access can change, particularly when competition for customer attention becomes more direct. If Roku were to decide to get into the media content game, good competitive strategy would likely indicate they would eventually replace a default Netflix app with a version of their own.
Not only is the possible entry of new participants a risk here, but so are the competing interests of their main rivals today.
Take AT&T for example. The company is not only an ISP (Internet Service Provider through their Communications segment) but also a content creator (through its HBO assets within its WarnerMedia segment). It’s unlikely that the company would do something so explicit as to block its ISP customers from accessing Netflix (you know, laws and regulation and all of that), but it could increase exposure to its HBO platform in more veiled ways, such as maybe including the app as a default in phones they service or packaging internet service with free HBO access, etc.
Almost every major competitor to Netflix has an interesting mix of businesses within each of its conglomerates—between movie studios, theater chains, and amusement parks—that each competitive strategy can have its own unique twist that either drives Netflix’s success today and in the future or could hinder that success.
Again, it’s impossible to analyze every possible factor, but if market share and new customer acquisition between the major players starts to shift towards a significant long term trend, it could be from one or a combination of industry dynamics.
I think the biggest tangible way this has played out so far has been with licensing deals. As these companies have launched their own streaming services, they have pulled some of their content assets out of the Netflix ecosystem by choosing not to renew certain licensing agreements. This could continue over time, which is why Netflix has been so focused on investing in its own exclusive content. It goes back to the amortization of its production assets and the long term ROI of those assets, and why I made the claim that they were key to a Netflix stock valuation estimate over the long term.
Interesting tidbit: management disclosed a recent 10-k that most of their agreements with partners tend to last 1-3 years, in the context of some of their delivery agreements. Licensing deals could also potentially follow this timeline, or they could also follow the amortization of Netflix’s produced content which is about 90% over the first 4 years.
Risk #3: Debt
Due to everything we’ve discussed in this valuation piece so far, it’s clear that Netflix had to spend heavily as a key competitive strategy. A significant portion of this had to be financed through debt, especially since the company was a growth company with little in the way of cash flows and profits (at least in the beginning).
From the 10-k, Netflix reported about $15.4 billion in Senior Notes. The interest rates on these notes fluctuate mainly between 3%- 6%.
Let’s take a standard solvency metric to analyze the totality of its debt, first with the Net Debt to EBITDA ratio.
EBITDA is not explicitly stated in the company’s income statement, so we’ll have to start with what we have and work our way up or down. In this case, I’ll use Operating Income to calculate EBIT, which the company reported as $6,194,509 thousand for 2021.

Next we want to get from EBIT to EBITDA, which means we need to add Depreciation and Amortization to EBIT. Looking at the company’s cash flow statement, this will mostly come from Amortization. The line item for Amortization of Content Assets was $12,230,367 thousand for 2021, and Depreciation and amortization of property, equipment, and intangibles was $208,412 thousand—adding this to EBIT brings us to a 2021 estimate for EBITDA at $18,633,288 thousand.

Net debt is much simpler to calculate, we can simply look at the company’s balance sheet.
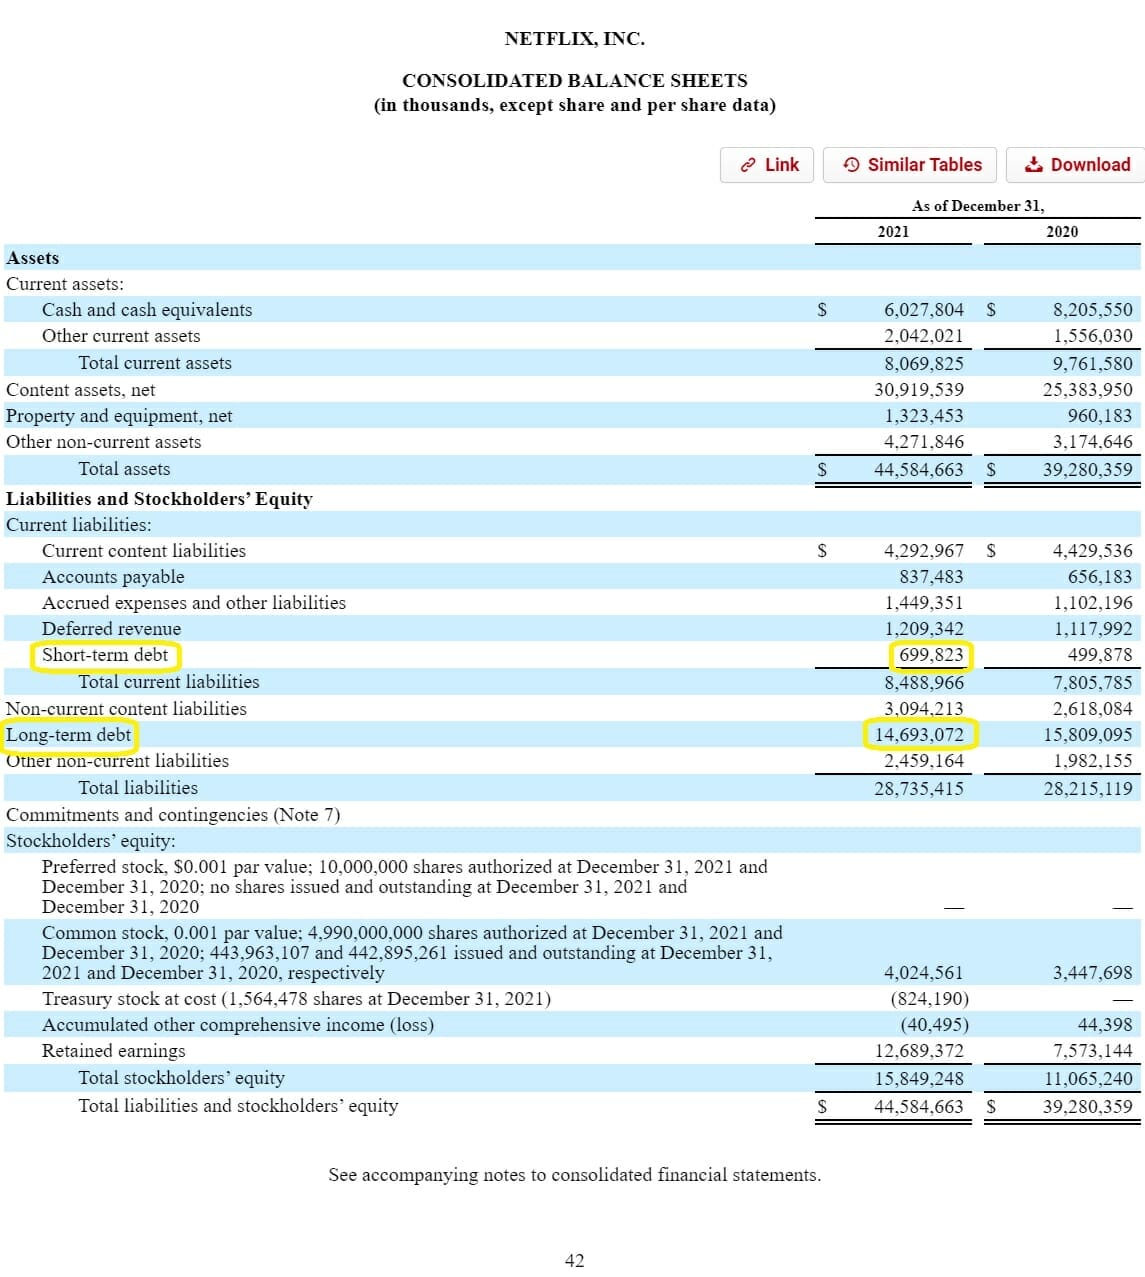
Simply adding the Short Term Debt and Long Term Debt item brings us to a Net Debt of $15,392,895 thousand.
We have the two components we need for Net Debt to EBITDA. The formula returns 15,392,895/ 18,633,288 = 0.83x. Comparing this to the market, the company’s total debt looks pretty good. Anything above 3.5x would be considered high, and Netflix falls multiples lower than that.
However, because of the potential unique relationship between Netflix’s content spend (included in Cost of Revenues) and amortization (to get from Gross Margin to Operating Margin), Net Debt to EBITDA might not be the best estimation of the company’s debt risk.
If the company spends less on future content, this would reduce Cost of Revenues (COGs) while amortization from past higher investment stays high – the combination of both increasing EBITDA – but the effect of this could be a reduction of future revenues from higher churn and lower customer acquisition, which would lower EBITDA.
Additionally, the EBITDA is under pressure from the many forces discussed in Risk #1 and Risk #2. So Netflix’s EBITDA might not be as reliable as another more matured company’s would be, making the Net Debt to EBITDA ratio a potential misrepresentation of the true risk of Netflix’s indebtedness.
Trying a few other debt ratios for Netflix:
- Interest Coverage Ratio = 8.09x
- Debt to Equity = 0.97
Understand that each of these metrics also have their own inherent risks and possible misrepresentations due to Netflix’s unique business model.
Therefore, a big picture view of these might work as a better analysis of the company’s solvency and its impact to your valuation estimate.
It also comes down to the company’s ability to produce future results similar to the past.
How to Value Netflix with a DCF
Now I’ll use a Reverse DCF (Discounted Cash Flow) Model to estimate how Wall Street is currently estimating Netflix’s intrinsic value.

Through a reverse DCF we can estimate how much growth Wall Street expects Netflix to achieve in the future.
If we think that estimated growth rate is higher, then Netflix is probably undervalued. But if we think Netflix will grow at rates lower than are currently implied by its price, then the company is probably overvalued.
To make this estimate, I plugged inputs into the Little Package of Valuation spreadsheet for Free Cash Flow to the Firm (FCFF) and used Netflix trading at a price of $189.27.
With some reverse engineering, we can find the following inputs as one way analysts might be estimating a DCF:
- Steady-state growth rate = 2%
- Operating Margin (normalized) = 20%
- Tax rate = 14%
- ROIC (projected) = 17%
- Cost of Capital/ WACC = 8.7%
- Sales to Capital Ratio = 1.18
- Revenue Growth = 8%
In my view, that growth rate for Netflix’s revenue over 10 years sounds reasonable. But there are some big assumptions underlying this FCFF (Free Cash Flow to the Firm) DCF model– mainly that Netflix will be able to convert most of its Operating Margin and into actual Free Cash Flow.
That’s a risk I’m not too sure about given Netflix’s unique business model, but I’m happy to be proven wrong. Overall, I think Netflix has a generally sticky model with serious long term compounding potential of Earnings Per Share, it just remains to be seen if the valuation is too expensive and will significantly slow this compounding rate.
It all comes down to your risk tolerance and your estimation of the company’s prospects, which makes valuation so fun and so personal.
Hopefully this business breakdown has been helpful for you, and I encourage perusing the other helpful links we’ve included on our website.
Updated: 7/8/2022
