Analyzing the future success of a company involves creating an industry map of current competitors, but should also account for the possibility of new market entrants. This is especially important if analyzing a company who is a “small fish” in a much bigger pond.
Of course, industry analysis is so important because of the nature of capitalism. High profit margins and return on capital attract competitors, and those competitors tend to cause margins and ROC to revert to the mean over time.
Saying it another way—if you have a tasty pie, capitalism will endlessly try and steal it, piece by piece.
That’s why if you are investing in companies with high margins and returns on capital, evaluating for the presence of a sustainable competitive advantage is essential. Without a sustainable competitive advantage, or moat, great financial success is unlikely to be sustained over a long period of time.
And if you’re a “small fish” who’s a leader in your small industry, you might be subject to the risk of much bigger fish, with much greater financial resources, entering your market and quickly taking your leadership.
But… sometimes a competitive moat can manifest from a lack of new market entrants to begin with, simply because the economics of an industry naturally repel big fish.
We will discuss the probability of new market entrants in an industry and how we might be able to estimate this using the two components of ROIC, with the topics moving in this order:
- The Background of Competitive Moats and Their Importance
- Competitive Moats and Return on Investment Example
- Analyzing Potential New Market Entrants With ROIC
- Examining the Two Components of ROIC for the S&P 500
- What’s the Rub: Margins or Invested Capital Efficiency?
- Investor Takeaway
There has been some great work done on the subject of competitive moats and competitive strategies from great thinkers already; hopefully we can add additional considerations to the discussion.
The Background of Competitive Moats and Their Importance
Because competition is constantly looking for new and better ways to invest capital for high rates of future return, a competitive moat is the only way a business with a high rate of return can continue to maintain its financial results.
A great quote by one of the greatest investors of all-time, Warren Buffett, in his 2007 letter to shareholders:
“A truly great business must have an enduring “moat” that protects excellent returns on invested capital. The dynamics of capitalism guarantee that competitors will repeatedly assault any business “castle” that is earning high returns… Our criterion of “enduring” causes us to rule out companies in industries prone to rapid and continuous change. Though capitalism’s “creative destruction” is highly beneficial for society, it precludes investment certainty. A moat that must be continuously rebuilt will eventually be no moat at all.”
Let’s think about some of the businesses who have found fantastic success in their stock prices, return on invested capital and growth rates, from their extremely strong competitive moats:
- Facebook- network effect from its large, active userbases
- Apple- incredible brand loyalty
- Microsoft- operating system that is the backbone of PCs
- Google- the undisputed search engine leader
Any company can have a sustainable competitive moat in its own way, and it all depends on an aspect of their products and services—whether a “consumer” advantage or “production” advantage.
Examples of production advantages are Home Depot and Costco, whose large warehouses combined with its scale and direct purchasing from vendors allow for sustained lower pricing against competitors, and a superior customer experience. Amazon falls in the production advantage bucket as well.
The great thing about companies with huge competitive moats is that they can provide continuous shareholder value through their capital allocation decisions.
Competitive Moats and Return on Investment Example
Say you were to fund a business with $10,000.
If that business was able to earn you $2,000 per year after paying for operating expenses and any investments, that represents a 20% ROI.
If that business were to pay the entirety of those $2,000 in earnings in dividends, then after 5 years the investment would’ve paid for itself.
However, say that the company was able to grow its earnings year-after-year by investing in some specialized equipment. In order to do so, it might retain some of its $2,000 in earnings rather than paying it all back in a dividend. This can be preferred for an investor if this results in higher dividends down the road, which can become more likely as a company’s earnings compound over time.
But it all depends on how much in retained earnings it will cost the company to earn higher rates of growth.
If a company were to reinvest all $2,000 of its earnings in long term assets but only recorded growth of $20, or a 1% ROIC, then that money would’ve probably been better served just given back to the investor as a dividend, where a higher rate of return could be earned for the investor.
But if the $2,000 reinvested in the business generated $500 in growth (25% ROIC) per year, then in the next year the company has $2,500 per year to distribute as a dividend or reinvest again.
If the company is able to continue to reinvest at a 25% ROIC, then earnings will swell as the company makes 25% on $2,500—generating growth of $625 vs $500 after the first year’s reinvestment of $2,000. As you continue to extrapolate this kind of compounded growth over time, the amount available in future dividends can swell compared to if the company just maintained a $2,000 earnings level, resulting in higher future ROI for the investor who funded the business with $10,000.
But, let’s say competitors observe this high ROIC of 25% and enter the market and slash prices, and steal market share.
If the ROIC for our company drops to 20% or 15%, then our long term ROI drops considerably and future growth potential is suppressed, as the business has to employ higher and higher rates of capital investment to earn similar growth rates to the past.
That’s why competitive moats are so key—guarding higher ROICs and growth rates to allow superior compounding to continue long enough to pay off handsomely for long term shareholders.
Analyzing Potential New Market Entrants With ROIC
Companies looking to grow are constantly examining their ROIC potential as it relates to their cost of capital (at least smart managements are).
Small companies with high ROIC need to be cognizant of this, because bigger companies tend to have lower costs of capital due to their size and can move in and really destroy their high ROIC as a new market entrant.
This also means that competitors with lower costs of capital might not demand as high of an ROIC as the incumbent industry leader, which will allow them to take competitive strategies which sacrifice margins (a large component of ROIC) in order to take market share.
What investors need to do is put themselves of the shoes of competitors (or potential competitors) to see how likely it is that a new market entrant will take such a competitive action.
If that is truly the case, the company better have a serious moat which differentiates itself and will allow itself to continue to grow at high rates of reinvested capital despite added competition.
To quantify this, we need to look at the components of ROIC one step further.
Michael Mauboussin had a fantastic report where he separated ROIC into two components:
- NOPAT / Sales
- Sales / Invested Capital
ROIC = (NOPAT / Sales) * (Sales / Invested Capital)
To simplify things for the purpose of understanding, you can substitute earnings as a proxy for NOPAT and long term assets as a proxy for invested capital.
Earnings/ NOPAT are heavily influenced by a company’s margins (gross, operating, and net), while Sales/Invested Capital is heavily influenced by capital expenditures needs.
Companies with great moats can earn superior ROICs by making either component into their competitive strength. Mauboussin postulates that a company with higher margins tends to have a “consumer” advantage, while a company with higher sales on its invested capital tends to have a “production” advantage. These can go hand-in-hand, however.
You can think of a low margins retailer like Home Depot as a great example of #1, where the stores themselves don’t need much maintenance capex but heavy operational spending is needed to achieve low prices.
An example of #2 might be a luxury store, where margins are higher due to premium pricing, but the higher prices make for lower volume of sales and thus a lower return on capital investments to maintain a similar size store.
There is no right or wrong answer to a source of a company’s competitive advantage, as companies can and do earn high ROICs by having superior margins or superior invested capital turnover.
Notice that the sales are in the denominator for one ratio and the numerator in the other, so they ultimately cancel out when calculating ROIC. But by separating ROIC into these two ratios, we can better understand when a company is likely to enter a new market or not, as it’s not solely about achieving higher margins or higher invested capital turnover. It’s about a balance of both.
Now let’s take this to the real world.
Examining the Two Components of ROIC for the S&P 500
I ran a calculation on the S&P 500 using the most year’s recent financial results (for 2020). This was a year that understandably had wide fluctuates in results for some businesses, but in the aggregate the database presented a good sampling of average, perhaps slightly suppressed, ROIC and its components.
Go back to the ROIC components formula again:
ROIC = (NOPAT / Sales) * (Sales / Invested Capital)
Let’s define it for simplicity sake like this:
ROIC = NOPAT Margin * Invested Capital Turnover
Using some datapoints from previous database analyses I’ve done, I found average operating margin over a 20 year period for the S&P 500 at 14.3%, with average net margin over the same period at 9.8%. Since NOPAT sits in the middle of Operating Income and Net Income, we’d assume that the NOPAT Margin for our dataset should sit in between.
In fact, I found the following for 2020:
- Average NOPAT Margin = 9.8%
- Average Invested Capital Turnover = 91%
- Average ROIC (incl’ M&A) = 14.7%
- Median NOPAT Margin = 12.7%
- Median Invested Capital Turnover = 65.5%
- Median ROIC (incl’ M&A) = 11.6%
Median NOPAT Margin of 12.7% fits in between the long term operating margin and net margin average, so we’ll use the medians for all of this.
To further validate the data, let’s look at a few low margins, high capital turnover businesses:
AMZN
- NOPAT Margin = 6.3%
- Invested Capital Turnover = 198.2%
- ROIC = 12.5%
HD
- NOPAT Margin = 12.9%
- Invested Capital Turnover = 270.5%
- ROIC = 34.9%
Take a traditionally higher capital intensive business, such as food packaging company Conagra:
CAG
- NOPAT Margin = 9.4%
- Invested Capital Turnover = 55.7%
- ROIC = 5.2%
We can see a lower than average invested capital turnover and relatively average margins, which has resulted in its lower than average ROIC and shows a company that has to make significant capital expenditures in the course of doing business.
What’s the Rub: Margins or Invested Capital Efficiency?
I think it logically makes sense to investors that if a company can earn higher return on invested capital by becoming a new market entrant, it will be more likely to do so.
But do margins or invested capital matter more?
Intuitively, it seems that new market entrants will have to sacrifice on margins more so than invested capital in order to find an eventual competitive advantage.
But is it a one-to-one ratio?
In other words, will 1% of margin reduction directly correlate to 1% lower ROIC? And at what point will this trade-off deter new market entrants?
And also important—is higher margins enough to attract new market entrants? Or is it the higher invested capital turnover which will attract competitors more?
I think we can get a sense for some of the answers to these questions by unpacking the math of ROIC one last time.
Examine the following charts:
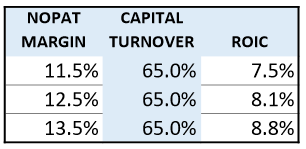

We’re starting at 12.5% and 65% because that was the median NOPAT Margin and Invested Capital Turnover we found for the S&P 500 in 2020.
But look at how a 1% change in margins did not have the same impact to ROIC as a 1% change in the invested capital turnover.
In fact, adding 1% in invested capital turnover only added 0.2% to ROIC, while adding 1% in NOPAT margin added 0.7%.
The reason for this is that because NOPAT margin is starting at a smaller base, a 1% improvement has a higher bearing on the final ROIC calculation than going from 65% to 66% in invested capital efficiency, even if that 1% represents the same amount of capital.
If we were to flip the numbers, making NOPAT margin at 65% (basically impossible but bear with me) and Invested Capital turnover at 12.5%, then we’d have the same effect but on the invested capital side.
The bottom line is that because most businesses tend to have higher invested capital turnovers in the S&P 500 than they do NOPAT margins, an increase in NOPAT margin directly affects ROIC more for the businesses (and industries) in which this applies.
So, based on mathematics, a company is 3x better off from an ROIC perspective to move into a market where it can reasonably improve company NOPAT margin than if it can become more capital efficient from lower capex spend—all things remaining equal.
Put Yourself in Management’s Shoes and Their Incentives
But remember, and this is key, a company acting in the interests of shareholders should generally only be looking to move up the chain in total ROIC.
It should only become a new market entrant if projected ROIC able to be earned is sufficient compared to other options, such as buying back shares. And if deciding between capital efficiency through capex and through margins, the mathematics seem to imply that targeting higher margins is likely to be a higher force multiplier for ROIC.
And so, perhaps surprisingly, a small fish company can thwart potential new market entrants (especially from big fish) simply by earning lower ROICs than its biggest potential (future) rivals.
In other words, a lower capital efficient business can actually have those economics be a sort of moat, provided its growth rates don’t draw too much attention.
At the right valuation, that can make a lower capital efficient business that’s a leader in its niche a great investment even if there are looming big fish in related industries which are (inappropriately) seen to be sources of foreboding competition.
Investor Takeaway
At the end of the day, the investor can only do so much when it comes to analyzing an industry, particularly when it comes to predicting the potential arrival of new market entrants.
Though prudent competitive analysis can prove that entering a new market can be shareholder destructive, that doesn’t necessarily prevent managements at large corporations from doing just that to satisfy other goals.
Investors in smaller fish type companies should be aware of that threat, and try to identify if or when it does happen.
But at the same time, just because a company is a small fish compared to the likes of Microsoft, Amazon, and Google doesn’t mean it can’t maintain a top spot in its industry—particularly if that industry has slightly lower rates of return than the big fish can earn in their own or related industries.
Use this type of competitive analysis when evaluating a company’s competitors or potential competitors as a way to test the competitive moat of a business.
After all, competitors in the book publishing business were wiped out when Amazon saw their higher operating margins as a nice place to become an entrant, so it’s not enough to only analyze current market competitors when analyzing an industry.
