Dave Ahern
Dave, a self-taught investor, empowers investors to start investing by demystifying the stock market.
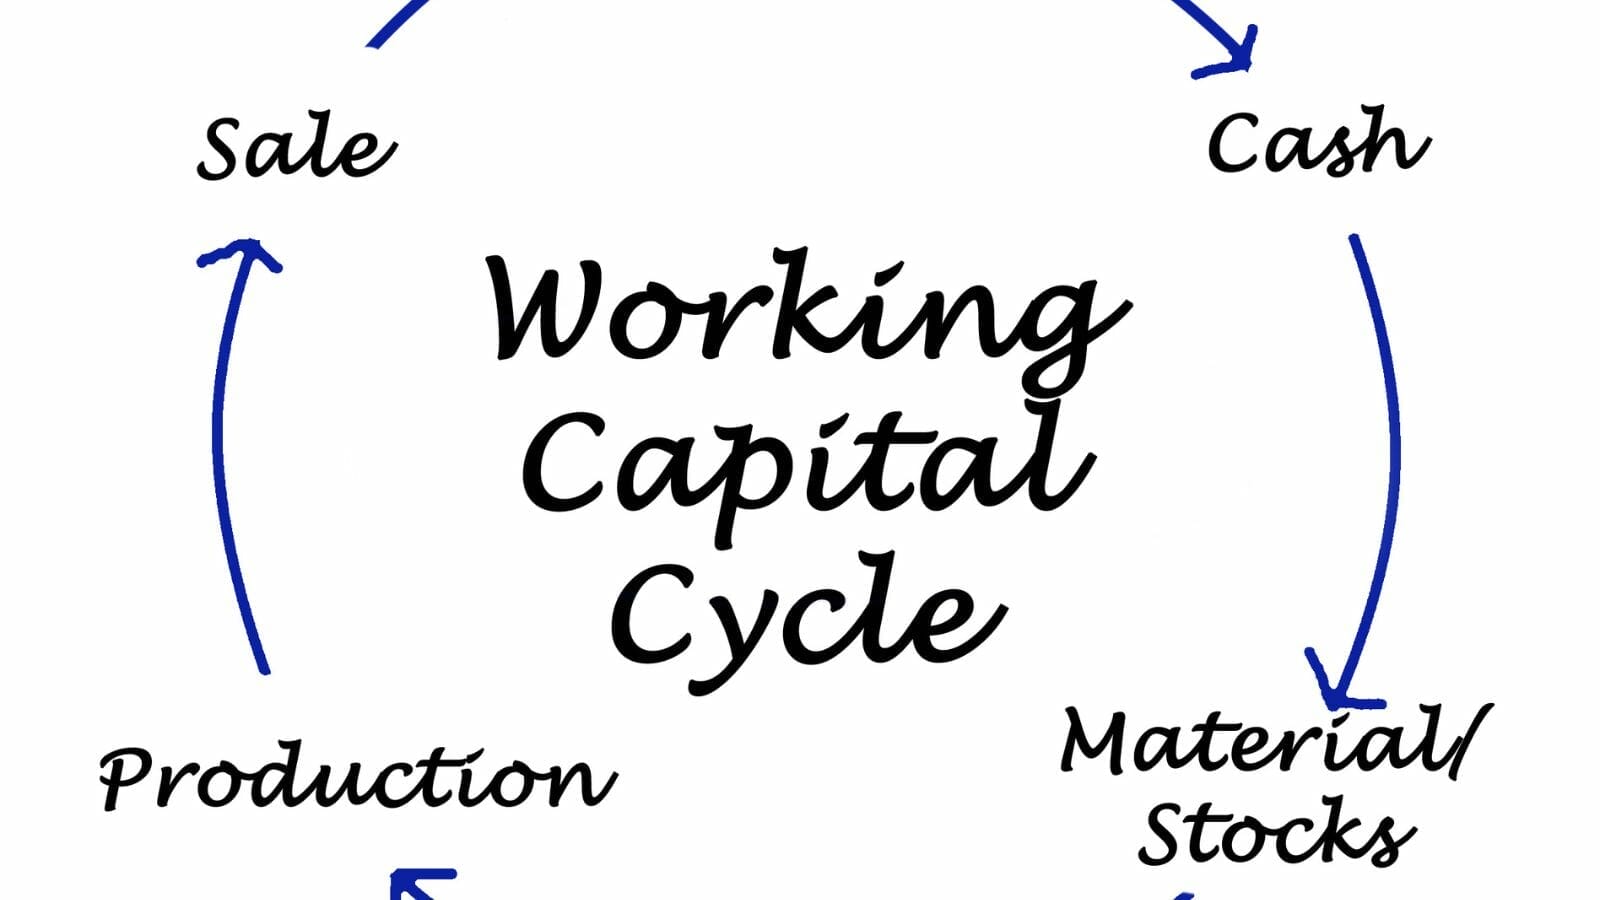
Working capital is one of the engines that drives a business to profitability and growth. It is the combination of current assets and current liabilities that the company uses for short-term needs. But the combination includes cash items such as short-term cash, which is not working capital.
Working capital is a critical component of valuation, and determining the drivers of the value of a company is understanding those drivers.
My investment teacher, Aswath Damodaran, presents a different way to look at working capital, which best captures the value drivers of working capital and gives us a truer valuation. Many of these ideas echo in the writings of the great Michael Mauboussin, another valuation guru, in his book Expectations Investing.
In today’s post, we will learn:
- What is Non-Cash Working Capital?
- Working Capital Vs. Non-Cash Working Capital
- How to Estimate Changes in Non-Cash Working Capital
Okay, let’s dive in and learn more about non-cash working capital.
What is Non-Cash Working Capital?
Before defining non-cash working capital, let’s look at the classic definition of working capital. The classic definition of working capital is the difference between current assets and liabilities.

Many working capital items include accounts receivables (unpaid bills from customers), inventories of finished goods or raw materials, and accounts payables.
The easiest way to think of working capital is the money Microsoft uses to cover its short-term expenses, such as buying inventories used within the calendar year.
Much of the working capital pay for inventory, short-term debt, and other day-to-day needs. We can consider these the operating expenses of Microsoft, and we know from our studies on valuation that improving operating margins helps grow the free cash flows. These improvements also filter the ROIC (return on invested capital) metric, which helps us measure the profitability and reinvest for more growth.
Working capital, also known as net working capital, ebbs and flows from company to company; some companies are more seasonal; think of retail as we approach the holiday shopping season. As that approaches, their need for working capital will grow.
Now that we understand working capital let’s look at non-cash working capital.
Per Professor Damodaran, non-cash working capital removes items not used for business operations. He suggests we back out items such as cash and investments in marketable securities. Removing items such as investments is because tying this cash up in treasury bills, short-term investments, or commercial paper means it is not available for daily operations.
These investments make the company money, albeit not much, because of the low yields in today’s low-interest-rate environment. But the bottom line is they make the company more money than the cash in inventories or accounts receivable.
Consider the cash tied up in inventories; it is a wasting asset, like accounts receivable. These items make the company no money while that pile of shoes sits in the warehouse, or the unpaid bill goes unpaid. Until you sell the shores or collect on the bill, does it become revenue.
There are exceptions; if the company carries a large cash balance that it uses for day-to-day operations, we should consider it in the working capital needs.
He also backs out all interest-bearing debt, such as short-term debt and the long-term portion of the debt due in the current period. He uses that portion of the debt when calculating the cost of capital, and counting it among working capital is double-dipping.
His definition of non-cash working capital is a little cleaner. He defines working capital as non-cash current assets (inventory and accounts receivable) less the non-cash current liabilities (accounts payable). He excludes any investment that ties up cash.
Any increases (decreases) in non-cash working capital will reduce (increase) cash flows for Microsoft during that period from a valuation aspect or cash flow view.
When we forecast future growth for Microsoft, it is important to forecast the impact of such growth on non-cash working capital needs and build those impacts into Microsoft’s cash flows.
Working Capital Vs. Non-Cash Working Capital
Next, examine the differences between working and non-cash working capital for Amazon (AMZN). We will use the latest 10-k report dated February 3, 2021, and all numbers will be in millions unless otherwise stated.

The chart below will break down the components of working capital, focusing on the current asset and liabilities. We will also note the differences between the classic and non-cash definitions of working capital. The non-cash working capital items will be in bold to help highlight the differences.
Line Item | 2019 | 2020 |
Cash and equivalents | $36,092 | $42,122 |
Marketable securities | $18,929 | $42,274 |
Inventories | $20,497 | $23,795 |
Accounts receivable | $20,816 | $24,542 |
Total current assets | $96,334 | $132,733 |
Non-cash current assets | $41,313 | $48,337 |
Accounts payable | $47,183 | $72,539 |
Accrued expenses | $32,439 | $44,138 |
Unearned revenues | $8,190 | $9,708 |
Total current liabilities | $87,812 | $126,385 |
Non-cash current liabilities | $47,183 | $72,539 |
Working Capital | $8,512 | $6,348 |
Non-cash working capital | $(5,870) | $(24,202) |
That is super interesting; this tells us that Amazon releases cash back into the cash flows instead of tying it up in non-cash current assets. All of which help increase the cash flows of the company.
Amazon’s example illustrates how the non-cash working capital affects the company’s cash flows; despite being a retailer, it doesn’t tie up large amounts of cash in its inventories and wastes that cash.
Removing the cash and equivalents from the classic equation shows how Amazon manages its working capital. If we look at the current ratio, total current assets divided by current liabilities, we see a ratio of 1.05 for 2020 and 1.09 for 2019. All of this tells us the company carries good liquidity in times of duress, but it doesn’t give us much info about the cash outlay for those items.
Let’s look at another example of non-cash working capital with an Amazon competitor, Walmart. Again, we will take the latest 10-k dated March 19, 2021.
Line item | 2021 | 2020 |
Cash and equivalents | $17,741 | $9,465 |
Receivables | $6,516 | $6,284 |
Inventories | $44,949 | $44,435 |
Prepaid expenses | $20,861 | $1,622 |
Total current assets | $90,067 | $61,806 |
Non-cash working capital | $72,326 | $52,341 |
Short-term borrowings | $224 | $575 |
Accounts payable | $49,141 | $46,973 |
Accrued liabilities | $37,966 | $22,296 |
Accrued income taxes | $242 | $280 |
Debt due within the year | $3,115 | $5,362 |
Operating leases due within a year | $1,466 | $1,793 |
Finance leases are due within a year | $491 | $511 |
Total current liabilities | $92,645 | $77,790 |
Non-cash current liabilities | $87,349 | $69,549 |
Working capital | $(2,578) | $(15,984) |
Non-cash working capital | $(15,023) | $(7,743) |
Again, interesting results are comparable with Amazon’s in that Walmart releases more cash-to-cash flows than tying it up in inventories or accounts receivable.
How to Estimate Changes in Non-Cash Working Capital
Estimating changes in non-cash working capital is fairly simple for a single year, as we saw from the charts above. But estimating future changes in non-cash working capital is a bit more problematic because the changes from year to year can be extremely volatile.

Some years will have big increases, followed by big decreases. A great practice is to tie the changes in non-cash working capital to revenues for valuation purposes. We can tie the projections of revenues or decreases to the increases or decreases in projected non-cash working capital changes. We can obtain the historical changes in non-cash working capital from the historical financials or use industry averages.
Let’s look at this in more detail, using Intel (INTC) as our guinea pig.
First, we will create a chart outlining the changes in non-cash working capital concerning revenues.
Line item | 2020 | 2019 | Change |
Accounts Receivable | 7,735 | 7,352 | (383) |
Inventory | 8,744 | 8,427 | (317) |
Other assets | 1,637 | 7,575 | 5,938 |
Non-cash current assets | 18,116 | 23,354 | 5,238 |
Accounts payable | 4,128 | 5,581 | 1,453 |
Accrued Expenses | 12,105 | 12,422 | 317 |
Other liabilities | 2,384 | 4,074 | 1,690 |
Non-cash current liabilities | 18,617 | 22,077 | 3,460 |
Non-cash WC | (501) | 1,277 | 1,778 |
Revenues | 71,965 | 77,867 | 5,902 |
Working Capital % of Revenues | (0.70)% | 1.64% | 30.12% |
Okay, now that we have looked at some historical numbers, we can start to project the non-cash working capital for Intel to work out an intrinsic value for the company.
The first step might be to use the change in non-cash working capital ($1,778) and project that at the same earnings growth rate into the future. However, as we mentioned, changes in non-cash working capital are unpredictable, and the last’s year might be an exception.
The same idea applies to the most recent years’ percentage of non-cash working capital to revenues because the changes are unpredictable and far from ideal.
Another choice would be to use the historical averages of non-cash working capital changes compared to revenues, which helps smooth out the ups and downs by annualizing those numbers. The trick would be to do it longer to get a better average. I worked that out for Intel over the last seven years, which is 0.93%.
The final choice is to use the industry average for the company and ignore the historical rates. This choice works for companies with extreme rate changes over time or working with microcap companies that start to see growth from scaling up.
Let’s put together a chart outlining how this lines up to help us make the best decision for our valuation.
Current | 1 | 2 | 3 | 4 | 5 | |
Revenues | 77,867 | 81,760 | 85,848 | 90,141 | 94,648 | 99,380 |
Changes in revenues | 3,893 | 4,088 | 4,292 | 4,507 | 4,732 | |
Current WC/Revs | 1.64% | 64 | 67 | 70 | 74 | 78 |
Historical Average | 0.93% | 36 | 38 | 40 | 42 | 44 |
Industry Average | 17.44% | 679 | 713 | 749 | 786 | 825 |
The above revenue growth is based on a 5% growth. We can use whichever revenue growth you choose, but you can see a wide range of non-cash working capital.
The big question then remains, can non-cash working capital be negative? And the answer is obvious, yes. Just look at the charts above for Walmart and Amazon. In the case of both companies, they use their suppliers as a means of managing their cash flows. By this, I mean that Walmart, for example, extends its cash flow cycle by extracting longer payback times for the products they buy from its suppliers. And then, Walmart can sell and collect cash for those products before paying for the products, which helps extend Walmart’s cash flows.
Amazon does the same thing, which helps Amazon extend its cash flows by reducing the inventory they need to carry and allowing them to turn over that inventory quicker. Leading to quicker cash flows for Amazon before paying its bills.
The faster the company can turn its inventory, the quicker it can gather the cash and use it for other purposes before paying its bills. It is part of the business model for Amazon and Walmart and helps explain why the companies have negative non-cash working capital. They are using their suppliers as non-cash working capital instead of their capital.
Let’s look at another company in the same sector to understand how this might work. I choose AMD as our next guinea pig, as they are in the same sector as Intel; it might be interesting to see how the two companies compare.
Below is a chart I compiled from a spreadsheet I will share to calculate these numbers easily.
The chart above outlines the historical non-cash working capital, last year’s non-cash working capital, and industry averages, all compared to AMD’s revenues.
A chart also projects revenues and non-cash working capital over five years. You could easily adapt the spreadsheet to project them over ten years.
Investor Takeaway
Working capital impacts the growth of a business; it tells us how much each company spends on its everyday expenses. The classic version includes cash and equivalents, which I think we have shown has little impact on the company’s day-to-day operations; excluding it from the calculations of working capital gives you better insight into the working capital needs of Intel.
The price we pay matters, and calculating the company’s intrinsic value is complicated with many moving parts. Part of the process is to protect the company’s working capital needs because no company can grow without spending money on inventory or accounts receivable.
The spreadsheet I include in the post will help you quickly and easily calculate the numbers to project for a DCF (discounted cash flow) model.
With that, we will wrap up our discussion on non-cash working capital. As always, thank you for taking the time to read this post, and I hope you find something of value in your investing journey. If I can further assist, please don’t hesitate to reach out.
Until next time, take care and be safe out there,
Dave
Related posts:
- Accounts Receivable Vs. Accounts Payable and the Working Capital Cycle In today’s business world, intangibles have grown in importance, but “old school assets and liabilities” such as accounts receivable and payable have grown in relevance....
- Short-Term Debt: Evaluating Financial Strength and Cash-Generating Growth Updated 2/7/2024 Short-term debt and current liabilities are often combined into the same bucket. When calculating a company’s debt-to-equity ratio, most investors use the total...
- Financial Accounting for Beginners: Debits/Credits, P&L, Assets/Liabilities Updated 8/7/2023 Recently, Berkshire Hathaway earned $81.4 billion in 2019, a 1,900% increase from the year before! How was this possible, by an accounting rule...
- Sales to Capital Ratio: Measuring the Efficiency of a Company’s Reinvestments One of Warren Buffett’s favorite metrics to measure a business’s efficiency to grow revenues is the metric, ROIC, or return on invested capital. When Buffett...
