NOPAT is an important measure of profitability. Investors use NOPAT to measure cash flows and ROIC (return on invested capital).
Our goal as investors to find profitable, high-quality businesses remains job number one. We want companies with high margins, low debt, capable management, and stable operations.
Companies generating high levels of NOPAT have great free cash flow and returns on capital.
All roads to valuing management lead to capital allocation and NOPAT remains an integral part of measuring those allocation skills. A high-quality team understands how to take resources and put them to their best use.
NOPAT can help us measure a management’s capital allocation as part of the ROIC ratio. ROIC involves using NOPAT to measure operating efficiency and Invested Capital to measure asset utilization efficiency.
We also use NOPAT as an integral part of valuing a company as free cash flow minus the investments necessary to grow the free cash flow.
The bottom line: NOPAT remains an integral part of finance.
In today’s post, we will learn:
- What is NOPAT?
- How Do You Calculate NOPAT?
- Step-by-Step Calculations of NOPAT with Visa’s Financials
Okay, let’s dive in and learn how to calculate NOPAT correctly.
What is NOPAT?
NOPAT equals net operating profit after taxes. Investors use NOPAT to measure how well it performs its core operations, net of taxes.

Many finance books refer to NOPAT as an unlevered measure of profitability because the metric doesn’t include interest payments and debt. NOPAT also helps measure the impact of capitalization or debt because of the absence of the measure.
NOPAT doesn’t measure the true profitability of the company. NOPAT excludes one-time charges such as mergers and acquisitions, which, if excluded, doesn’t paint a true picture of the profitability.
NOPAT is more a measure of the efficiency of the company operations, and so, it doesn’t represent the profitability of the company.
Analysts use many different measures when assessing an investment company. Most analysts use measures of performance such as sales and net income growth (earnings).
Sales provide insight into the top-line performance of the company but don’t provide any insight into operational efficiency.
Net income or earnings includes operating expenses and any tax savings from debt.
NOPAT offers a go-between or hybrid calculation. NOPAT allows investors to compare company performance without the impact of debt. NOPAT gives investors better insight into the operating efficiency of Visa, for example.
Because NOPAT removes the influence of debt, it allows investors to compare companies. NOPAT gives a better apples-to-apples comparison.
For example, we can compare two companies in the same industry—one with no leverage and the other with a large debt.
As I mentioned earlier, NOPAT is integral to calculating intrinsic value. We use NOPAT as free cash flow in the FCFF (free cash flow to the firm) DCF model.
We have to adjust for several changes. For example, NOPAT doesn’t include changes in net working capital. It also includes non-cash expenses such as depreciation and amortization. Plus, NOPAT doesn’t adjust for any capital expenditures.
But NOPAT remains the starting point for calculating intrinsic value. We adjust the measure for any impact from investments. Investments are a must for any company to grow, even Apple.
How Do You Calculate NOPAT?
NOPAT equals net operating profit after taxes. NOPAT measures the company’s profits less any tax benefits from debt.

Among many analysts, NOPAT remains interchangeable with several other terms:
- EBIT – Tax effected
- EBIAT – Earnings Before Interest After Taxes
We will focus on EBIT as our base to measure NOPAT.
Tax effect refers to the point that NOPAT doesn’t include interest expense, along with the direct impact of taxes paid via the interest tax shield.
NOPAT represents the total operating income Visa generates. The operating income is available to all capital providers, whether debt or equity (i.e., equity shareholders or bondholders).
The starting formula for calculating NOPAT includes the following:
NOPAT = EBIT * (1 – Tax rate)
Where EBIT equals Visa’s gross profit minus the operating expenses for the period. Keep in mind operating expenses will include items such as:
- Depreciation
- Salaries
- Rent
- Inventories
- R&D
The company’s taxes include cash taxes, tax provisions, deferred taxes, and the tax shield; more on these items soon. We can use the effective tax rate for the company as well.
It may seem strange to add back amortization but not depreciation, even though they are both non-cash charges.
Here’s the rationale per Michael Mauboussin:
“Depreciation is correctly considered an operating expense because it reflects wear and tear on physical assets. For instance, a company that buys a machine with a useful life of five years will record it in property, plant, and equipment (PP&E) on its balance sheet and depreciate the asset on the income statement over its life.
Amortization of acquired intangibles reflects different accounting. Assume a company acquires a customer list. The company would post the list as an intangible asset on the balance sheet and amortize it over its estimated useful life. But the money it spends to maintain and grow the list is expensed on the income statement.”
A newer development for calculating NOPAT includes the impact of a new GAAP accounting ruling. The ruling includes embedded interest from operating lease expenses. We add the interest back to NOPAT.
For companies in the US, we need to separate leases payments into two parts:
- Depreciation as an expense
- Embedded interest as a financing cost
This leads us to add back the embedded interest back to NOPAT.
Next, we have the cash tax calculations, which have three parts.
- Tax provision
- Deferred taxes
- Tax shield
The first part is the tax provision, which we can start using the line item we see on the income statement. For example, Visa’s income tax line indicates the company owes $3.1 billion.
Next, we need to adjust for deferred taxes. This step has a few parts. Most companies keep two books—one for reporting financials and the other for taxes. Companies use straight-line depreciation for taxes. This can create timing issues, with Visa’s reported taxes often higher than cash taxes.
Visa will have to pay those taxes eventually and that is why they record them as a deferred tax liability. But Visa’s tax liability can remain on the books for years.
We must calculate yearly changes to reflect this item in Visa’s cash taxes. We can do this by calculating the balance sheet’s change from one year to the next, taking the line item deferred taxes, and subtracting one year from the next.
For example, we can see the deferred tax liabilities from Visa’s latest balance sheet from its 10-K, dated 11-8-21.
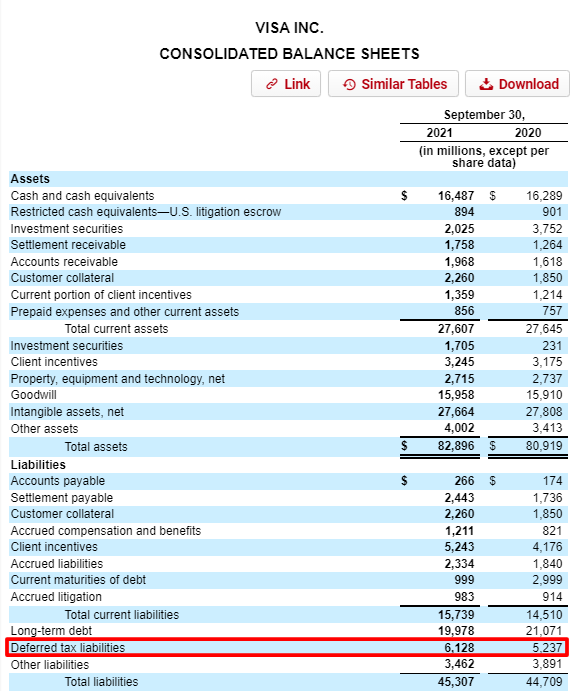
We would take the numbers:
- Deferred tax liabilities 2021 = $6,128 million
- Deferred tax liabilities 2022 = $5,237 million
- Difference = $891 million
Now, we will look at the same procedure using the deferred tax assets. Because we use the liability side of the balance sheet, we need to account for the asset side. We can find these under the notes section by using the CTRL-F function.
Visa’s deferred assets equal:
- 2021 = $1,046 million
- 2020 = $846 million
- Difference = $200 million
We would take the difference and reduce Visa’s cash taxes. Visa’s reported taxes equaled $3,752, which we now reduce by $891 million, giving us a value of $2,861 million.
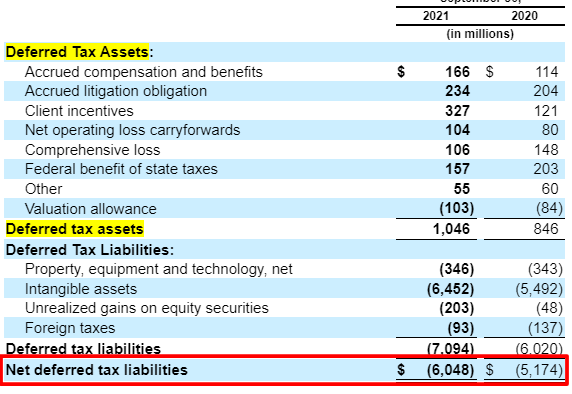
An easier way includes finding the net deferred tax liabilities, which would include both assets and liabilities, and then reducing or increasing the company’s cash taxes.
The final part of calculating cash taxes is the tax shield companies see from interest expense deductions.
The tax shield represents the difference Visa pays in taxes versus the higher taxes they would pay if Visa financed the company totally with equity. The interest expense helps shield Visa and others from having to pay some taxes.
To calculate the tax shield, we multiply the company’s net interest expense by its marginal tax rate, which increases cash taxes for companies with higher debt. But it puts all companies on the same playing field for comparisons.
For example, Visa had $259 million of the net interest income (expense) on their latest 2021 income statement, with a tax rate of 23.4%.
Thus the tax shield equals:
Visa tax shield = $259 x 23.4% = $61 million
Okay, now that we have worked through the process, let’s put it into action to help better understand the calculations necessary and where to find the numbers.
Step-by-Step Calculations of NOPAT with Visa’s Financials
We have eight steps we need to follow to determine the NOPAT for any company. The steps are:
- Find operating income or EBIT
- Determine amortization of intangibles
- Find operating lease payments
- Calculate EBITA (EBIT + Amortization)
- Find the income tax provision
- Calculate the deferred taxes
- Calculate the tax shield
- Calculate Cash taxes
We will use Visa’s latest 10-K, dated 11-18-21, and we will need information from various sources. Some of the information we will pull directly from the income statement or balance sheet. We will need to find others from the notes to financials using the CTRL-F function to search for the specific data.
1. Find operating income or EBIT
Operating income, or EBIT is the easiest; we pull it directly from the income statement.
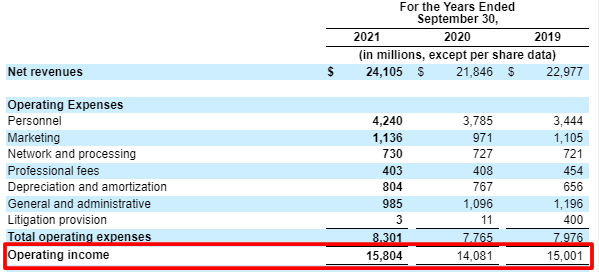
Visa’s operating income or EBIT for 2021 equals $15,804 million.
2. Determine amortization of intangibles
To find this, we will use CTRL-F to search for amortization, of which we will find our information in the notes section as seen below:
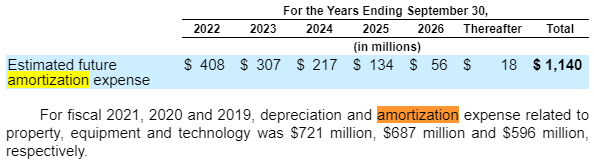
The amortization expense for 2021 equals $721 million.
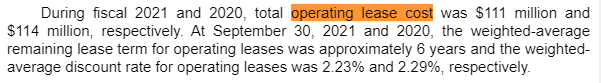
3. Find the operating lease payments
Again returning to the notes and using our search function, we find the operating lease cost, which equals $111 million.
4. Calculate EBITA (EBIT + Amortization)
Taking our above numbers, we can calculate the EBITA necessary to continue our calculations for NOPAT.
- EBIT = $15,804 million
- + Amortization of intangibles = $721 million
- + Operating lease expense = $111 million
- EBITA = $16,636 million
5. Find the income tax provision
We will find Visa’s and any other company’s income tax due from the income statement, right below the earnings before taxes or EBT. Some companies will label this as income taxes or income tax provisions, but they all equal the same result.
Visa’s tax provision for 2021 equals $3,752 million
6. Calculate the deferred taxes
Here we will look for the net deferred taxes using the search function. We want to find the net deferred tax liabilities. Some companies will list both deferred assets and liabilities on the balance sheet, while others will be more opaque and you will need to use the search function to find the information.
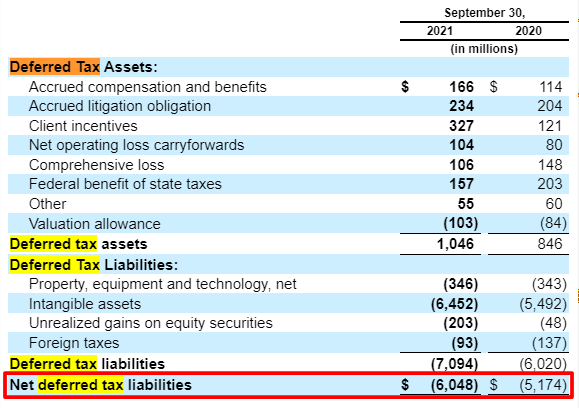
Remember, we want the difference from one year to the next. So we will subtract 2021 from 2020, which gives us a value of $874 million in deferred tax liabilities.
7. Calculate the tax shield
To calculate the tax shield, we will return to the income statement. We need to find the net or non-operating income (expense), which includes interest expense, the cost Visa pays for borrowing. Visa can get a tax benefit from the expense it pays, thus the tax shield.

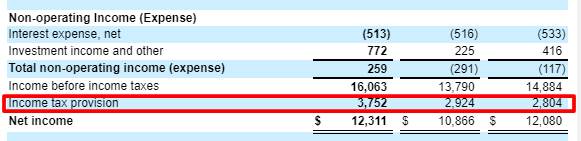
We find that our non-operating income (expense) equals $259 million. We can also find the numbers we need to calculate the tax rate for Visa:
- Income before income taxes = $16,063 million
- Income tax provision = $3,752 million
- Effective tax rate = $16,603 / $3,752 = 23.3%
Now, we can calculate the tax shield:
Tax shield = $259 million * 23.3% = $60 million
8. Calculate cash taxes
Now we have all the numbers necessary to calculate our cash taxes for Visa.
- Tax provision = $3,752 million
- + Deferred taxes = $874 million
- – Tax shield = $60 million
- Cash taxes = $4,566 million
Now, we can calculate our NOPAT by subtracting our cash taxes from our EBITA calculations from above.
EBITA = $16,363 million
Cash taxes = $4,566 million
Now our NOPAT equals $16,363 million less $4,566 million, which gives us a value of $11,797 million.
Investor Takeaway
A company’s value stems from projecting future free cash flow (FCF) and discounting it to the present. Free cash flow (FCF) equals NOPAT minus investments necessary for future growth.
We defined NOPAT today, and investments for future growth include changes in net working capital, capex less depreciation, and other investments such as M&A.
You can define future growth by the change in investment capital.
Andrew recently defined Invested Capital in his epic post, and by putting NOPAT together with Invested Capital, we arrive at ROIC (return on invested capital).
As you define operating income and invested capital, you discover the components that drive a company forward. For example, Microsoft, Google, and Visa remain a product of their assets which help grow the company.
ROIC helps measure the efficiency of using those assets, and companies with higher ROIC rates offer better long-term investments. As long as the company can generate returns above its costs of capital, the company will thrive.
History abounds with successful companies, and if you dive deeper, you will find companies generating higher returns on invested capital over long periods, as those returns exceed investment costs.
With that, we will wrap up our discussion on NOPAT.
Thank you for reading today’s post; I hope you find something of value. If I can be of any further assistance, please don’t hesitate to reach out.
Until next time, take care and be safe out there,
Dave
