Price-to-earnings, or P/E ratio as it is also known, is probably the most recognizable metric used to value stocks. Are they the most useful? Well, for one, they don’t consider any company growth, and no one metric is useful all by itself. We can use them with other metrics. The PEG ratio combines all benefits of value investing and adds to the growth component.
Mario Farina created the PEG ratio and wrote about the ratio in his book, “A Beginners Guide to Successful Investing in the Stock Market,” published in 1969.
Peter Lynch, the famous investor, later popularized it in his book, “One Up on Wall Street,” published in 1989. He wrote in the book:
“The P/E ratio of any fairly priced company will equal its growth rate.”
For those unfamiliar with Lynch, he was the fund manager for the Fidelity Magellan Fund, which he took over when he was 33 and ran for 13 years. His record of 29.2% annualized returns during the 13 years more than doubled the S&P 500 during the same period.
Lynch used the PEG ratio to determine the fair value of stocks and screen for undervalued companies.
Today we will learn:
- What is the PEG Ratio?
- How Do You Calculate the PEG Ratio?
- What is a Good PEG Ratio?
- PEG Ratio by Industry
OK, let’s dive in and look deeper at the PEG ratio.
What is the PEG Ratio?
From Investopedia:
“The price/earnings to growth ratio (PEG ratio) is a stock’s price-to-earnings (P/E) ratio divided by the growth rate of its earnings for a specified time period.
The PEG ratio is used to determine a stock’s value while factoring in the company’s expected earnings growth and is thought to provide a more complete picture than the P/E ratio.”

The PEG ratio is easy to calculate and gives you a quick snapshot of the value and growth of a company. The ratio can also tell if the company is undervalued compared to its earnings growth.
Let’s take a look at how to calculate the ratio.
How Do You Calculate the PEG Ratio?
The formula for the PEG Ratio is:
PEG Ratio = (Price / EPS) / EPS Growth
- Where EPS equals earnings per share
To calculate the PEG ratio, we will need numbers that we can gather from the annual or quarterly reports. You can cheat and pull the numbers from your favorite financial website, but I like to go straight to the source, as it keeps things consistent.

Let’s break this down a little bit more.
The formula is the P/E ratio divided by the earnings per share growth.
The formula’s first part is calculating our company’s P/E ratio. Again, there are two ways to do this: look up the PE ratio from your favorite website, or use the numbers from the latest financial reports.
We need the company’s current price and earnings to calculate a price-to-earnings ratio.
Next, we need to find the earnings growth rate; again, we can use the info from a financial website to look for the analyst’s growth estimate for the next five years, or we can use the information from the financial reports, look at the historical growth of earnings, and use that for our basis.
I like to use the historical growth rates as a measure, as opposed to future growth rates from analysts, with no offense to the analysts; I think basing the future growth rate on what the company has already done makes more sense.
To calculate the earnings growth, you can either look at the earnings reported on the income statement or use the company’s EBITDA earnings for the last five years.
We calculate the EBITDA earnings by taking the operating earnings from the income statement and adding the depreciation and amortization from the cash flow statement. It’s a little more work, but I feel it gives a more accurate reading.
Once we have the EBITDA earnings for the last five years, we need to find the CAGR rate of these earnings. CAGR means finding the combined average growth rate over five years. I use a calculator from Investopedia for the CAGR calculations, but you can calculate your own from Excel.
OK, let’s look at our first company.
We could analyze Universal Forest Products (UFPI) for our first example. Universal Forest has a current market cap of $4.28B, and the company deals with wood.
The numbers we need to gather to calculate our PEG ratio:
- Current market price
- Earnings per share
- The EBITDA growth rate for five years
First, let’s find the current market price for UFPI by looking it up on your favorite financial website, mine being stratosphere.io. The current market price is $68.46.
OK, that was easy; now let’s look at the earnings.
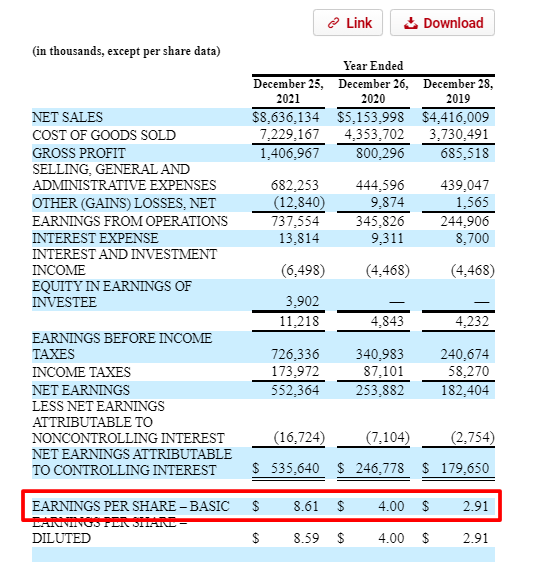
So our earnings per share for UFPI is $8.61 for the year ending 2021. You could do the same for a company using their quarterly reports or 10-Q.
Next, we will look up the EBITDA for Universal Forest by looking at our favorite financial website. We are using six years because we need five years of growth, and the first year doesn’t count as a growth number but as a starting point.
Now we can pull those numbers and find our EBITDA earnings for our PEG ratio.
- LTM – $1,001 million
- 2021 – $823 million
- 2020 – $431 million
- 2019 – 313 million
- 2018 – $262 million
- 2017 – $234 million
Now that we have found our EBITDA, we can find the earnings growth rate for the last five years.
Here we go:
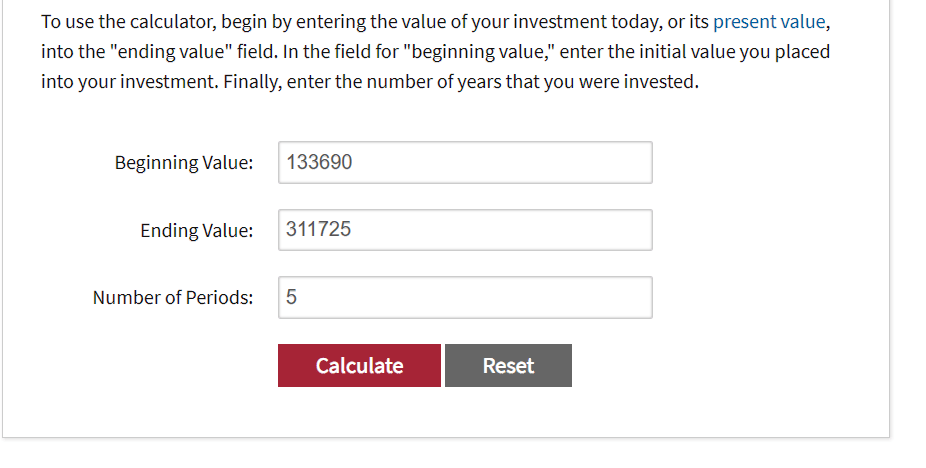
Notice that we enter our first number from the chart for EBITDA from 2017 of $234 million as our beginning value and the ending value of $1,001 million from the same chart. I put five periods because we are looking at the change in values from 2017 to LTM, which encompasses five years.
And once we hit the calculate button, we get our result, which is 33.73%
Now that we have our growth rate for the EBITDA, we can go ahead and calculate the PEG ratio for Universal Forest Products.
PEG Ratio = ( Current Price / EPS ) / Growth of EBITDA
- Current Price = $68.46
- Earnings Per Share = $8.61
- Growth Rate of EBITDA = 33.73%
Let’s plug the numbers into our formula.
PEG Ratio = ( 68.46 / 8.61 ) / 33.73
PEG Ratio = 7.95 / 33.73
PEG Ratio = 0.23
Now, wasn’t that fun and pretty darn easy too? We will discuss the results more in the next section.
I want to look at a few more to ensure we have the concept down.
Remember, we are looking for undervalued companies with good growth as investments; that is the sweet spot.
Let’s take a stab at Disney; with the rocky stock market of late, the price of Disney has fallen dramatically over the last couple of weeks.
Currently, the market price for Disney equals $98.12.
Their earnings per share from the latest twelve months equals $1.75.
Next, I will create a chart listing the EBITDA from Disney’s latest financials.
- LTM – $11,926 million
- 2021 – $8,063 million
- 2020 – $9,126 million
- 2019 – 16,197 million
- 2018 – $17,848 million
- 2017 – $16,655 million
Going back to our calculator, we find our growth rate for the EBITDA.
The growth rate for Disney for EBITDA over the five years is -6.47%.
Now that we have all components for Disney, let’s calculate the PEG ratio.
PEG Ratio = ( Current Price / EPS ) / Growth Rate of EBITDA
PEG Ratio = ( $98.12 / $1.75 ) / -6.47
PEG Ratio = 56.06 / -6.47
PEG Ratio = N/A or negative because of the negative growth rate.
OK, that was pretty easy; why don’t we try one more to ensure we have the hang of this?
Let’s do Visa and see what our results will be. For Visa, I am going to do an abbreviated version.
The current market price for Visa is $180.59, and Visa’s EPS as of the most current last twelve months equals $6.79.
The range of EBITDA for Visa from 2017 to LTM is:
- 2017 = $12,633 milllion
- LTM = $19,788 million
The growth rate for the last five years is 9.34%.
Now that we have our numbers, let’s plug everything into our formula.
PEG Ratio = ( 180.59 / 6.79 ) / 9.34
PEG Ratio = 26.60 / 9.34
PEG Ratio = 2.84
Now that we have done a few, I think we have the hang of calculating a PEG ratio for any company we are interested in buying or selling.
Let’s take a look at interpreting the results of our calculations.
What is a Good PEG Ratio?
As with the P/E ratio, a lower PEG ratio is better. The standard answer is that we are looking for a number below one for the best results. A result lower than one may indicate that the company is undervalued.

And likewise, any calculations using estimated numbers are going to be suspect. That is why I like to use historical numbers; they base them on events that have occurred. We can argue about whether my assumptions about Visa, for example, will continue to grow their earnings at 9.34% over the next five years.
But if you base your projections on forward-looking numbers, these are strictly a guess or forecasting, and no one knows the future.
If you use the PEG ratio from a published site, it is important to determine the growth rate used in the calculation. For example, gurufocus.com uses the P/E ratio based on the current-year numbers and a five-year growth rate of EBITDA.
We can calculate the PEG ratio based on one-year, three-year, and five-year growth rates, and the formula is only as good as the numbers we use for our calculations. Garbage in, garbage out.
The degree to which the PEG ratio can tell us how undervalued a company is depends, to some degree, on the industry and company type.
Peter Lynch was a firm believer that the P/E ratio and the growth rate of the earnings should be equal, which would indicate a fairly valued company. When a company expands beyond a ratio of one, it is considered overvalued.
If we take our results from the above test cases:
- Universal Forest Products – 0.23
- Disney – Negative growth
- Visa – 2.84
What does all that tell us? At first blush, it would appear that Universal Forest Products is the most undervalued of the bunch, and that Disney is the most overvalued of the group.
The apparent overvaluation of Disney could be that the market expects more growth than our estimates predict or, more likely, that increased demand for the stock has driven the price higher.
A PEG ratio less than one could indicate that the estimates for growth are too low for the company or that the market underestimates the company’s growth and value.
A PEG ratio can be negative; if the company’s present income is negative, such as Tesla, then the company will have to have negative earnings. There is also the possibility that future earnings may turn negative, as many companies will probably experience in the upcoming quarters as the economic fallout from the pandemic comes to light.
Negative PEG ratios are considered worthless for companies with high risk.
One of the criticisms of the ratio is that it fails to properly consider the relationship between the P/E ratio and growth because it fails to factor in return on equity.
Another criticism is the varied use of different growth numbers, from the length of samples, net earnings, or EBITDA. There is no current formula standardization, which can lead to many different options for calculating the ratio.
One big disadvantage to the ratio is it is less effective for measuring companies without high growth. Large, well-established companies like Johnson & Johnson, a perennial dividend aristocrat, offer a great dividend but little in the way of growth.
PEG Ratio by Industry
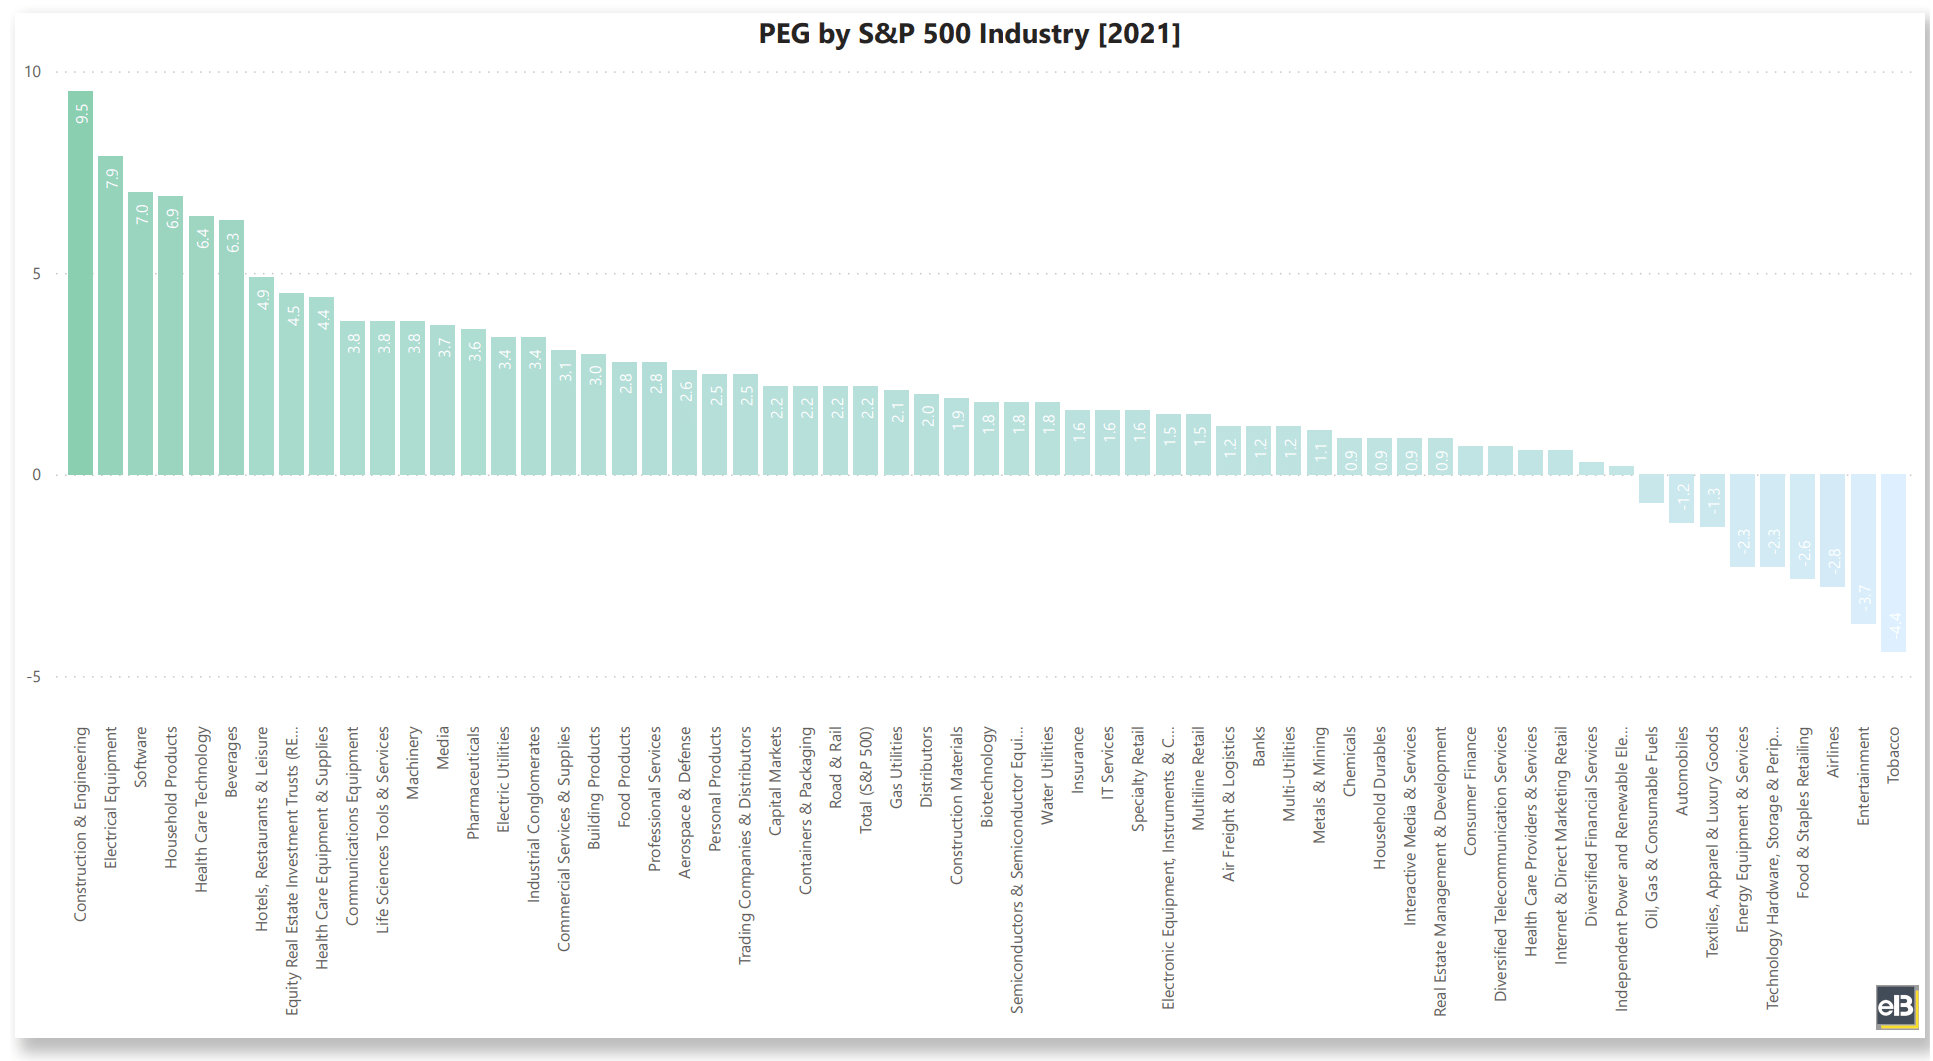
According to the research by Professor Damodaran, the overall PEG ratio for the market is currently 1.15. From his website, I will show a smattering of a few industries so we can see how they compare to our test companies.
- Banks – 0.68
- Biotech – 1.65
- Oil/Gas – 0.68
- Healthcare Products – 3.31
- Software – 1.93
Note that one of the industries getting savaged in the market right now is the airline industry. Those companies have a PEG ratio of 0.69, indicating the industry’s overall undervaluation.
As value investors, we are always looking for a deal, BUT beware of value traps! In an environment like today, with so much volatility, it pays to research and ensure you understand the whole picture and not just rely on one variable.
Andrew has done some research for me showing the results of a 20-year backtest on the PEG ratios of every company in the S&P 500, in addition to the performance results of these companies compared to their PEG ratios.
In other words, if the company has a low PEG ratio, the chart shows how the company performed over that period.
The current PEG ratio for the S&P 500 sits at 1.8, an all-time high, although they have only tracked the ratio since 1986.
Here is a list of some of the better sites that allow you to sort by the PEG ratio:
Any of the above screeners can help you find great companies with a PEG ratio below one or a company close to one – a great place to start your analysis of the company.
Final Thoughts
The PEG ratio is a great starting point for finding undervalued companies exhibiting growth in their earnings. I like to use EBITDA as my earnings numerator because, in part, it is harder to manipulate with share buybacks.
As you become more comfortable analyzing companies, you will discover some companies that may have flat earnings, but because the company is continually buying back shares and reducing the share count, they will, in turn, elevate the earnings per share.
The PEG ratio is another tool we can add to our toolbox when examining a company. It is fairly easy to calculate and gives a quick look at the possibility of being undervalued by the market, with a growth aspect to boot.
If it was good enough for an investor as skilled as Peter Lynch, it is good enough for me.
As always, thank you for taking the time to read this article.
I hope you find something of value that you can use on your investing journey.
If I can be of any further assistance, please don’t hesitate to reach out, and I will help in any way that I can.
Take care and stay safe,
Dave
