Updated 4/28/2023
One of the biggest challenges when determining whether or not to invest in a company is determining each company’s financial strength. Enter the Piotroski Score, and use the easy rating scale to help you learn a company’s strengths.
Value investors love this rating scale as it gives you a good initial insight into all aspects of the financial statements. It utilizes the income statement, balance sheet, and cash flow statement.
As we will see, the Piotroski score is a simple device to seek out great, undervalued companies.
The Piotroski score helps you find profitable companies with improving margins, don’t employ accounting tricks, and strengthen balance sheets.
In today’s post, we will learn:
- What is the Piotroski Score?
- What are the Piotroski Criteria?
- Breakdown of Related Terms
- Piotroski Score in Action
- Final Thoughts
Let’s dive in and look at the PIotroski Score and how we use it.
What is the Piotroski Score?
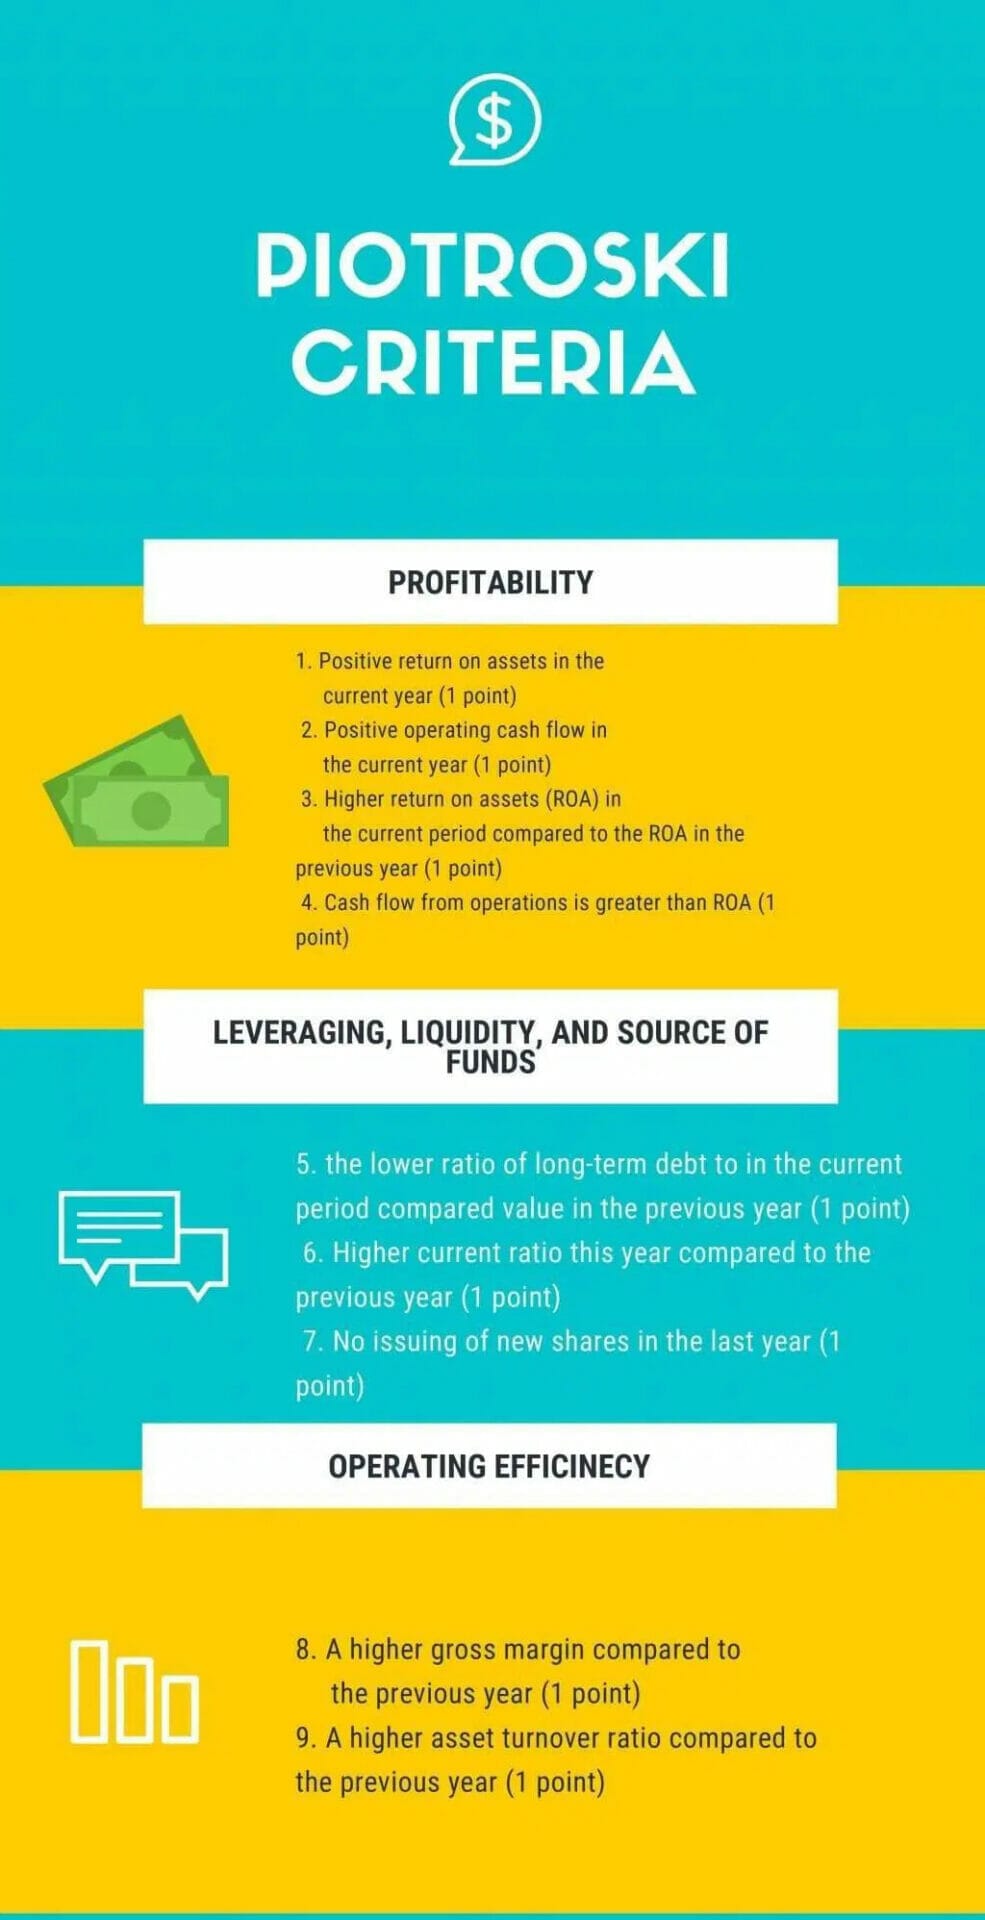
The Piotroski Score varies from 0 to 9, with 9 being the peak score possible. Based on the nine criteria used to determine a company’s financial position’s strengths, the score uses the range to help find the top companies.
Named after Chicago Accounting Professor Joseph Piotroski, the Piotroks Score uses the companies’ different financial multiples.
The Piotroski Score focuses on each company’s accounting results, specifically over the last few years. We award each company a point for every criterion and every metric not met a zero.
Ultimately, we add the points to determine which company is the best value stock.
Sounds pretty easy, huh?
What are the Piotroski Criteria?
Let’s break down the criteria into distinct segments.
Next, a breakdown of the scoring and how it works.
We consider a company that scores 8 or 9 a great value. On the other hand, if a company records 0-2, we consider it a mediocre company with weak financials.
Breaking Down Terms Used in the Piotroski Score
Let’s peek at some of the terms and break them down.
- Return on Assets – the ROA shows us how profitable our company’s assets are in creating revenue. Learn more about the formula for ROA here.
- Operating Cash Flow – refers to the cash from normal business operations. It is the cash before any financing or investment activities. We will find this in the statement of cash flows.
- Long-term debt – debt due longer than 12 months in the future — to bondholders or banks; some companies issue debt to fund growth or pay back other debt. Long-term debt lists below the current liabilities section in the balance sheet.
- Current Ratio – we use this ratio to give you an idea of its ability to pay back short-term liabilities with the company’s short-term assets. We find all the data on the balance sheet. A great indicator of a company’s liquidity is the current ratio.
- Gross Margin is the ratio between revenue minus the cost of goods sold divided by the company’s sales. Expressing the margin as a percentage, we look for a higher number. The more profit a company keeps from each dollar of sales, the better positioned it is to cover its other costs and debt payments.
- Asset Turnover Ratio – an efficiency ratio that measures a company’s ability to create sales from its assets by comparing net sales to average total assets. The asset turnover ratio helps us understand how the company generates revenues from its assets and the process’s efficiency.
Piotroski Score in Action
Okay, we have looked at the Piotroski Score, some terms, and why it exists.
Our first guinea pig is Texas Instruments (TXN), a semiconductor leader with a $153.5B as of April 26, 2022.
On another note, all numbers will be listed as millions unless otherwise stated.
To begin, we will gather some numbers from the 10-k from 2022. I prefer to use the 10-ks if possible, but we can use the TTM or 10q to access the most up-to-date numbers by all means.
To start, we will look at examples of where to find each number:
- Net Income
- Cash Flow from Operations
- Revenue
- Gross Profit
- Average Total Assets
- Total Assets
- Long-Term Debt & Capital Lease Obligation
- Total Current Assets
- Total Current Liabilities
Texas Instrument’s Net Income comes from the income statement.
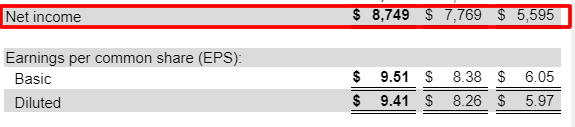
Texas Instrument’s Net income = $8,749 million
Next, the Cash Flow from Operations will come from the cash flow statement.

Cash Flow from Operating Activities = $8,720 million
Next up is revenue
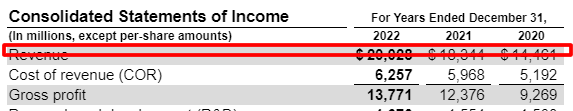
Texas Instrument’s revenue = $20,028
Next, let’s look at the gross profit, located in the consolidated earnings statements. We calculate gross profit as Revenue minus the Cost of products (goods) sold. Many companies will list the gross profit, and some won’t, but it is a good idea to understand how to calculate.
Generally, the relationship between the cost of goods sold to revenues goes a long way toward profitability. A company that can control its costs has a better chance of profitability.
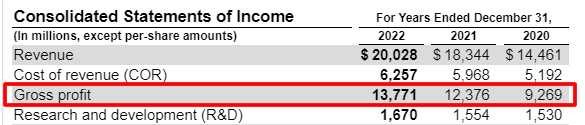
Gross Profit = $13,771 million
We calculate the Average Total Assets by adding five years of Intel’s total assets from five years of 10-ks and dividing by five.
Next, the balance sheet to locate the total assets. I will illustrate where to find the first year and then pull the others together for us.
Texas Instrument’s total assets for 2022 = $27,207
For our five years:
- 2021 = $24,676
- 2020 = $19,351
- 2019 = $18,018
- 2018 = $17,137
Next, let’s find the average by adding the assets up and dividing by five:
$27,207 + $24,676 + $19,351 + $18,018 + $17,137 / 5
Texas Instruments’s Average Total Assets over the five years = $21,278
Next, let’s find the total assets at the beginning of 2022 by looking at the total assets from 2021.
Texas Instrument’s total assets at the beginning of 2021 = $24,676
Next, we must locate the long-term debt and contractual obligations or leases. We will find long-term debt directly under the current liabilities section on the balance sheet.
We classify long-term debt as any debt due over twelve months.
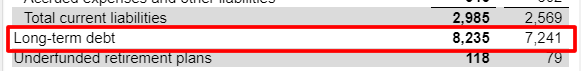
Long-term debt = $8,235 million
Next, let’s find the total current assets, which again are on the balance sheet.
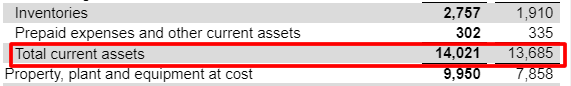
Total current assets = $14,021 million
And lastly, we need to locate the total current liabilities, returning again to the balance sheet.
Current liabilities for 2022 = $2,985 million
After gathering our numbers, we can answer the questions to determine our Piotroski score for Intel.
Scoring For Texas Instruments
Profitability
Q1: Return on Assets
Net Income for 2022, positive at $8,749, score = 1
Q2: Cash Flow from Return on Assets
Current Cash Flow from Operations, positive at $8,720, score = 1
Q3: Change in Return on Assets
Compare this year’s ROA to last year’s ROA.
ROA ( 2022 ) = Net income / Total Assets ( Dec 2022)
ROA = $8,749 / $27,207
ROA = 32.1%
ROA (2018) = $7,769 / $24,676
ROA (2018) = 31.4%
Return on assets for 2022 was higher than in 2021, 32.1% to 31.4%, score = 1
Q4: Quality of Earnings
Let’s Compare cash flow from return on assets to return on assets.
Texas Instrument’s current net income was $8,749. Texas Instrument’s current cash flow from operations was $8,720. So $8,749 is greater than $8,720, CFROA > ROA score = 1
Funding
Q5: Change in leverage
Next, compare this year’s leverage, long-term debt divided by average total assets, to last year’s leverage.
Leverage ( 2022 ) = $8,235 / $21,728
Leverage = 37.9%
Leverage (2021 ) = $7,241 / $24,676
Leverage = 29.3%
Intel’s leverage for 2022 was 37.9%, and its leverage for 2021 was 29.3%.
Therefore 2022 is higher than 2021, and Texas Instrument’s leverage was higher this year, score = 0
Q6: Change in Working Capital ( Liquidity )
Compare Intel’s 2022 current ratio ( current assets divided by current liabilities ) to 2018’s.
We score +1 if the current year’s ratio is higher and zero if lower.
Current Ratio (2022) = Total Current Assets / Total Current Liabilities
Current Ratio = $14,021 / $2,985
Current Ratio = 4.69
Current Ratio (2021) = $13,685 / $2,569
Current Ratio = 5.32
Intel’s current ratio for 2022 is 4.69, and for 2021 was 5.32. With 2022’s current ratio lower than 2021, the score = 0
Q7: Change in Shares Outstanding
Compare the number of shares outstanding to the previous year’s number. If Texas Instruments has higher shares outstanding in 2021 than in 2022, score one.
Texas Instrument’s outstanding shares in:
- 2022 – 916
- 2021 – 923
Giving us more shares issued in 2021, score = 1.
Efficiency
Q8: Change in Gross Margin
Compare 2022’s gross margin to last year’s; score one if 2022’s gross margin is higher and zero if the gross margin is lower.
Gross Margin (2022) = Gross Profit / Revenue
Gross Margin = $13,371 / $20,028
Gross Margin = 66.7%
Gross Margin (2021) = $12,376 / $18,344
Gross Margin = 67.4%
Putting together the above numbers, we can see:
- 2022 – 66.7%
- 2021 – 67.4%
Giving us a higher number in 2021 than 2022, score = zero
Q9: Change in asset turnover
Compare Inte’s 2022 asset turnover and 2021’s asset turnover ratio.
Score one if this 2022’s asset turnover ratio is higher, zero if the turnover ratio is lower.
Asset Turnover (2022) = Revenue / Total Assets 2018.
Asset Turnover = $20,028 / $27,207
Asset Turnover = 73.6%
Asset Turnover (2021) = $18,344 / $24,676
Asset Turnover = 74.3%
We have a lower turnover ratio for 2022 compared to 2021, score = zero
Piotroski Scorecard
- Q1 = 1
- Q2 = 1
- Q3 = 1
- Q4 = 1
- Q5 = 0
- Q6 = 1
- Q7 = 1
- Q8 = 0
- Q9 = 0
Total score = 6
A great result would be 7, 8, or 9, with a poor score being 1, 2, or 3.
Texas Instrument’s score is 6, which is a pretty good score, with the company improving its score over the last three quarters:
- Dec22 – 5
- Sep22– 6
- Jun22 – 8
For giggles, let’s try another, shall we?
Let’s look at AMD, one of Intel’s biggest competitors in the semiconductor world.
AMD has a market cap of $103.20 billion, a P/E ratio of 113.99.
Okay, now that we know a little bit about the company, let’s look at AMD’s Piotroski score.
For this example, I will pull together the information and walk you through the questions. We will gather the numbers from its TTM or year ending September 2020.
- Net Income = $3,162 million
- Cash Flow from Operations = $3,521 million
- Revenue = $16,434 million
- Gross Profit = $7,929 million
- Average Total Assets = $9,171 million
- Total Assets at the beginning of 2021 = $8,962 million
- Long-term Debt = $349 million
- Total Current Assets = $8,583 million
- Total Current Liabilities = $4,240 million
Q1: Return on Assets
AMD’s current Net Income is positive at $3,162 million, score = 1
Q2: Cash Flow on Return on Assets (CFROA)
AMD’s current cash flow from operations was positive at $3,521 million, score = 1
Q3: Change in Return on Assets
AMD’s Return on Assets 2019 = Net Income / Total Assets
ROA 2022 = 3,162 / 9,171
ROA 2022 = 34.4%
Return on Assets 2021 = 2,490 / 8,962
ROA 2021 = 27.7%
AMD’s ROA for 2022 was higher at 34.4% than 2021 at 27.7%, score = 1
Q4: Quality of Earnings
Compare AMD’s CFROA to ROA.
AMD Net Income for 2019 was $3,162, compared to its current Cash Flow from Operations, $3,521.
Because AMD’s Cash Flow from Operations was greater than Net Income, 959 > 879, score = 1.
Q5: Change in Leverage
Compare AMD’s 2020 leverage ( long-term debt divided by total average assets ) to 2019’s leverage.
Leverage 2022 = $349 / $9,171
Leverage 2022 = 3.8%
Leverage 2021 = $531 / $9,171
Leverage 2021 = 5.7%
AMD’s 2022 leverage of 3.8% was lower than the leverage of 2021 at 5.7%, score = 1
Q6: Change in Working Capital
Compare AMD’s 2022 current ratio (current assets divided by current liabilities) to 2021’s current ratio.
Current Ratio = Current assets / Current Liabilities
Current Ratio 2022 = 2.00
Current Ratio 2021 = 2.50
AMD’s current ratio for 2022 was lower at 2.0 than the 2021 number of 2.5, score = 0
Q7: Change in Shares in Issue
Compare the number of shares outstanding in 2022 to those of 2021.
AMD’s number of shares outstanding is 1,213, compared to 2021’s shares available of 1,184, with a larger number of shares available this year, score = zero.
Q8: Change in Gross Margin
Compare AMD’s gross margin of 2022 (gross profit divided by sales) to 2021’s gross margin.
Gross Margin 2022 = Gross Profit / Revenue
Gross Margin 2022 = 48.2%
Gross Margin 2021 = 44.5%
AMD’s gross margin in 2022 was 48.2%, higher than 2021 of 44.5%, with this year’s gross margin higher, score = 1.
Q9: Change in asset turnover
Compare AMD’s 2022 asset turnover (total sales for the year divided by total assets at the beginning of the year) to 2021’s asset turnover ratio.
Asset Turnover = Revenue / Total Assets at the beginning of the year 2021
Asset Turnover 2022 = 1.35
Asset Turnover 2021 = 1.30
AMD’s turnover ratio for 2022 was 1.35, which was higher than in 2021 of 1.30. With the turnover ratio higher in 2022 than the 2021’s, score = 1.
AMD’s Piotroski Score for TTM (Sep20).
- Q1 = 1 point
- Q2 = 1 point
- Q3 = 1 point
- Q4 = 0 point
- Q5 = 1 point
- Q6 = 0 point
- Q7 = 1 point
- Q8 = 1 point
- Q9 = 1 point
Piotroski Score for AMD 2020 TTM = 7
Remember that a great score is 7, 8 or 9.
The final result is a great score and indicates that AMD is in a good situation financially.
Overall, the Piotroski score illustrates what we probably already know about this company: they are a stable, mature company with strong financials, with uncertain growth in the competitive semiconductor sector.
Others in the sector:
- Taiwan Semiconductor – 7
- Intel – 3
- AMD – 5
- Nvidia – 5
Comparing the different Piotroski scores of competitors is a great way to screen for a stronger financial company. Remember that this process is only as good as the data we feed and is only a screening device. After finding a company with strong financials, continue your research process.
Final Thoughts
The Piostroski score is a straightforward way to analyze any stock and determine its overall value.
Once you gather the data, setting up the score is lengthy but easy to implement.
As value investors, there are multiple methods for determining any company’s value we are trying to analyze. But using the Piotroski score allows us to touch all the company’s financials. Plus, it gives us great insight into the company’s financial strength.
With that, we will wrap up our Piotroksi score discussion.
As always, thank you for taking the time to read this post, and I hope you find something of value on your investing journey.
If I can further assist, please don’t hesitate to reach out.
Until next time, take care and be safe out there,
Dave
