The price to sales ratio (or the P/S ratio) has long been a reliable metric for uncovering value because (1) sales tend to be more consistent, and (2) they give a way to value companies that aren’t profitable. But this is changing as high tech companies become more of the norm.

And you can see it by the simple way that the Price to Sales ratio is calculated.
In this post, we’ll discuss:
- The basics of the Price to Sales ratio
- When the P/S ratio is a poor indicator of valuation
- Historical (20 year) data of the P/S for the S&P 500
- Average Price to Sales Ratio by Industry (historical)
Whether you’re a value investor or one who is a beginner, you might find the following conclusions to run counter to a lot of the information on the internet today. I hope after reading this post fully you’ll understand why.
Price to Sales Ratio Basics
Before we start, know that Net Sales and Revenue really means the same thing with most companies. It’s going to be the “top line” of a company’s income statement, and represents money coming in to the company before taking out most expenses (only a few exceptions).
I hope I don’t have to spend too much time on this explanation, because the P/S ratio is really a simple division formula:
Price to Sales (P/S Ratio) = Market Capitalization / Net Sales
Another way you can calculate the formula is like this:
P/S Ratio = Share Price / (Net Sales per Share)
In general, a lower Price to Sales ratio is preferred in most value investing circles. Like the Price to Earnings (P/E) ratio, this formula can show how much in sales that you’re getting as an investor compared to the price you’re paying for a company.
For example, if a company has a P/S of 1 and trades at a Market Capitalization of $15 billion, that company will have Net Sales of $15 billion.
An investor buying a stock with a P/S of 1 is “getting” $1 in sales for every $1 invested.
As a valuation like P/S or P/E gets higher, the investor gets less sales and earnings power for every $1 invested, which can be detrimental for an investor if the stock eventually settles at a certain P/S or P/E range, as often happens with mature businesses.
The Price to Sales ratio was popularized in the great book What Works on Wall Street—as a back-test in that book and by other great investors—has shown that buying low P/S stocks every year and rebalancing the portfolio annually has historically led to superior returns in many of the years that were examined.
When the P/S ratio is a Poor Indicator of Valuation
Remember that the Price to Sales ratio simply takes the top line, Net Sales, and compares it to the price of the stock—either market capitalization if looking at Net Sales or Share Price if looking at Net Sales per Share.
However, we should also remember that over the long run, stock prices tend to follow earnings—and so the Price to Earnings (P/E) can become a good proxy for simple valuations.
As the logic goes, earnings can fluctuate wildly from year to year thus distorting P/E, so P/S can be a better indicator from year to year.
But it’s a terrible indicator for high net margin businesses.
Let’s take a simple example to illustrate this point, and hopefully make it super simple.
Say you have two companies in the same industry, we’ll call them:
- Efficient Eagle Corp
- Spendy Sales Inc
Now, we’ll assume for simplicity sake that each company earned the same amount of earnings in one year ($100). But, let’s say that the net margins for each business were different—EE Corp had a 20% net margin while SS Inc had a 10% net margin.
Net margin = Net Income / Sales. You can also manipulate that equation to be Net Margin * Sales = Net Income. We’re just moving the Sales from one side of the formula to the other.
With this information, the net earnings of each company and the net margins of each company, we can calculate each company’s Net Sales with the following calculations:
- Efficient Eagle Corp
- Earnings = $100
- Net margin = 20%, Net Sales = $500
- To verify: ($500 * 0.2) = $100
- Spendy Sales Inc
- Earnings = $100
- Net margin = 10%, Net Sales = $1,000
- To verify: ($1,000 * 0.1) = $100
Since these businesses are in the same industry, we can reasonably assume that their P/E ratios would be pretty close (if they’re growing earnings at roughly the same rate). We’ll assume that both have the same P/E ratio—at 15 P/E.
So, both companies would have a market cap of $1,500 ($100 * 15).
What’s the Price to Sales ratio for each company?
- Efficient Eagle Corp
- Market cap = $1,500
- Net Sales = $500
- P/S ratio = 3
- Spendy Sales Inc
- Market cap = $1,500
- Net Sales = $1,000
- P/S ratio = 1.5
You can see that we have two different businesses with wildly different operating strategies—EE Corp is great at keeping costs down and so it needs less sales to make the same earnings as Spendy Sales Inc.
But based on a Price to Sales ratio, Spendy Sales seems like the better value (1.5 vs 3), and it’s a direct result of the fact that the company doesn’t manage its costs well, resulting in a lower net margin.
Applying the Faultiness of the Price to Sales Ratio to Industries
We can take this same logic and apply it to industries we know well. Think about some of the lowest net margin businesses around us today. Things like:
- Grocery stores
- Big retail
- Oil Companies
- Banks
These businesses tend to need to spend a lot to make a lot, which means they have lower net margins, which means they will have lower P/S ratios!!
What about businesses that are very inexpensive to operate? Things like:
- Software companies
- Fabless semiconductor designers
- Digital payment processors
The companies in these industries could easily have P/S ratios above 5 or 10, and still be relatively inexpensive as a direct result of the fact that these companies churn out profits with lower sales!
The Price to Sales Quandary
So you really have a problem as an investor with the structural nature of the P/S ratio.
When they say, “you can’t have your cake and eat it too”, they should’ve also said: you can’t have great margins and low Price to Sales valuations (this same logic applies to the P/B ratio and high ROE, by the way).
As someone who is innately a value investor, constantly trying to find companies with a margin of safety and trading below their intrinsic value, I’ve had to come to grips with the fact that the Price to Sales and Price to Book ratios weren’t as valuable as I once thought. I’ve had to evolve my thinking, and that meant shattering my preconceptions and biases, and re-learning about the stock market as if I was a little baby.
Blindly applying the P/S ratio can lead to the following mistakes:
- Using too low of a P/S ratio in your stock screener can exclude you from the most profitable industries in the world
- Putting too much heavy weight into the P/S ratio as a relative valuation tool against competitors can exclude you from business models that are just plain better at controlling costs than their competitors
Now, that’s not to say that the Price to Sales ratio doesn’t have its place.
- You can very much so make the argument that companies with low net margins can make overhauls to their cost structures for massive improvements in earnings.
- You can also very much make the argument that some industries become so out of favor with Wall Street that they are battered to obscenely low P/S ratios, making for fantastic value investments.
But you have to balance those possibilities with the very real, structural problems with the Price to Sales ratio.
And I’ll also include these very pertinent quotes from Warren Buffett, who has been the best value investor of my generation and purchased stocks with high P/S ratios:
Whenever I read about some company undertaking a cost-cutting program, I know it’s not a company that really knows what costs are all about. Spurts don’t work in this area. The really good manager does not wake up in the morning and say, “This is the day I’m going to cut costs,” any more than he wakes up and decides to practice breathing.
Time is the friend of the wonderful business. It’s the enemy of the lousy business. If you’re in a lousy business for a long time, you’re going to get a lousy result, even if you buy it cheap.
Final Warning: That’s not to say either that companies with little earnings and Price to Sales ratios of 50+ are fine to invest in too. Just because an expensive growth company seems like it will figure out profitability one day, doesn’t mean that it will.
The stock market has many historical examples of investors who’ve been burned because of this exact same faulty logic.
Historical (20 year) data of the P/S for the S&P 500
Now we get to my favorite part, the cold hard historical facts. To compile this list, I took the current constituents of the S&P 500 (as of October 20, 2020).
Then I took the following metrics over the last 20 years (FY2001-FY2020):
- Price to Sales Ratio
- Net Income Margin
Then, I took the median of the above in order to come up with the chart. The reason for using the Median instead of Average is because the Average gets distorted from extremes in values.
Here’s the data in all its beauty:
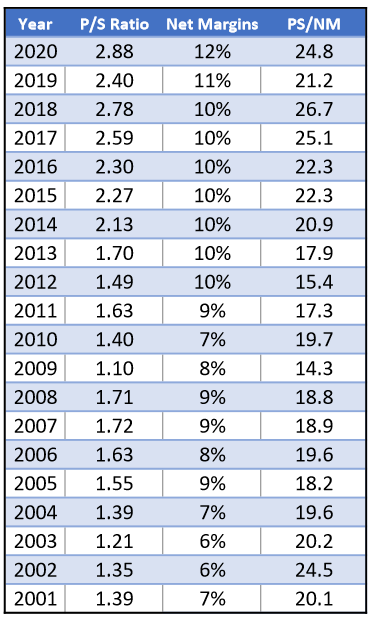
The first observation is that while the median P/S ratio of the S&P 500 has increased steadily over time, so have Net Margins.
It’s impressive on the business side that the S&P 500 has consistently gotten better with their margins, especially over the last 2 years. Some of that could have to do with lower corporate taxes, but I think also that technology has collectively cut costs for many businesses.
Price to Sales vs Net Margins Conclusions
The ratio in the 3rd column is one that I completely made up, but it’s just median (Price to Sales / Net Margin), which a reader astutely pointed out is also simply P/E.
This ratio will help us understand to what extent the increase in the Price to Sales ratio has followed the improvement in Net Margins.
You can see that the PS/NM ratio has fluctuated from as low as 15 to as high at 24, and I believe it’s a pretty good indicator for how expensive the P/S ratio has historically been compared to Net Margins.
For a sanity check…
Let’s take the 24.7 for 2020 and 21.1 for 2019, and compare them to the 24.6 in 2002 and 20.2 in 2003.
Note: I rounded the percentages above for easier comprehension, but included the percentages by decimal point in the following calculation for a higher accuracy.
Take the years with PS/NM at around 24.5 first:
- 2020; 2002
- P/S = 2.88; P/S 1.35
- Difference = +113%
- NM = 11.6%; NM = 5.5%
- Difference = +111%
An almost perfect correlation. Where a value investor might look at the P/S average of the S&P 500 at 2.88 and gather that it’s higher than its historical average over the last 20 years, that value investor might miss that it has largely followed the increase in Net Margins since 2002.
Another one as a sanity check. For the years with PS/NM around 20-21:
- 2019; 2003
- P/S = 2.40; P/S = 1.21
- Difference = +98%
- NM = 11.3%; NM = 6.0%
- Difference = +88%
The correlation for this one is not as close, as maybe the P/S increases to 2019 slightly outpaced the accompanying improvements in Net Margins, but not as much.
What’s clear from both of these examples is that though the Price to Sales has doubled since 2002-2003, stocks could still arguably be just as valuable on a Price to Sales basis as they were back then—at least in the case of those companies with superior margins and earnings power.
Average Price to Sales Ratio by Industry (Historical)
Everyone would probably like to see this dataset as well, and I don’t blame them. What we’re going to find is that industries can vary greatly in their Price to Sales ratios, and sometimes this is due to a simple reason: a better net margins profile.
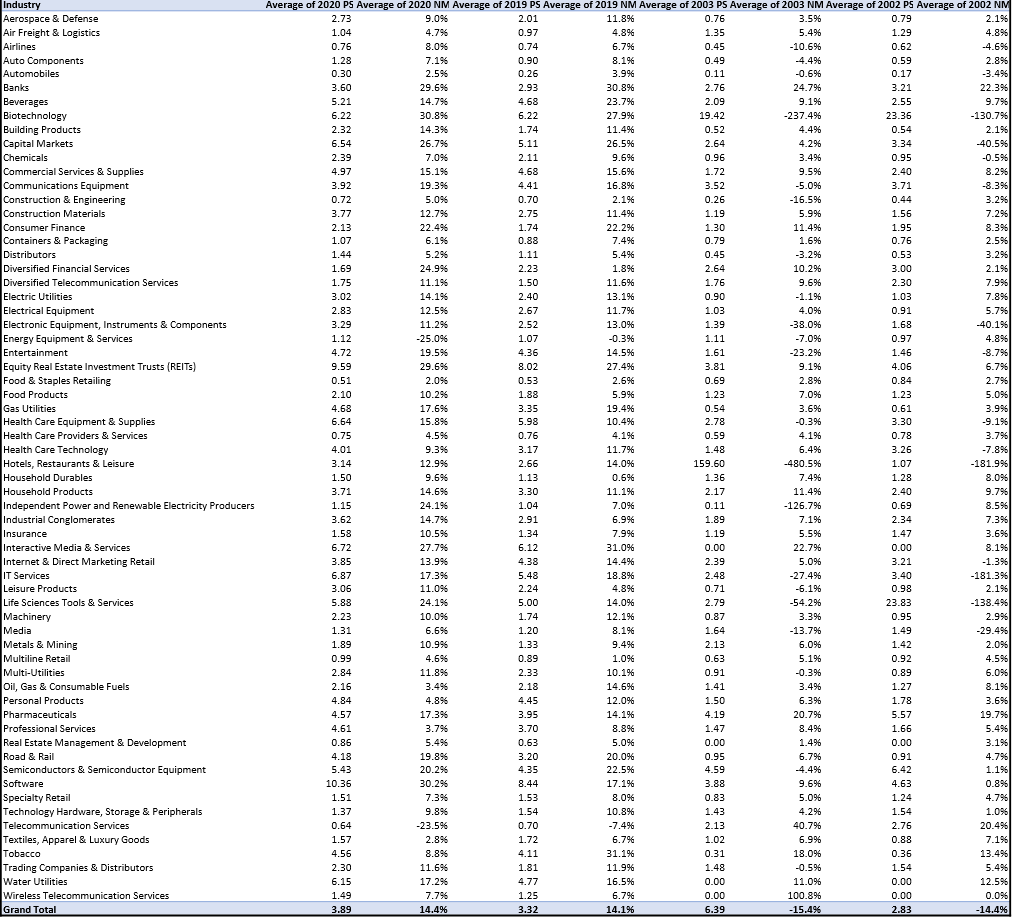
Click to zoomNote that these values vary slightly from the other S&P 500 table above, due to these calculating average P/S ratios rather than Medians.
What I find interesting about this data I also don’t find surprising. Industries like Software and Life Science Tools have high P/S but also high Net Margins.
Some of the lowest P/S ratio industries like Construction & Engineering and Foot & Staples Retailing also have rock bottom margins.
Investor Takeaway
Many investors tend to like high margin businesses since they, generally, take less investment dollars to achieve higher earnings growth.
But that’s not to say that low margin businesses are worthless either. If a low margin business can increase revenues by 10%, that’s still a direct 10% increase to earnings as that growth it makes its way down the income statement.
Over the long term, investors are probably best suited to strike a balance.
Just because a business has high margins doesn’t mean it can’t mature (and have growth slow), and just because a business has low margins doesn’t mean its in a mature industry.
At the end of the day, it really comes down to future growth.
Take these quotes from legend value investors:
“The average market price of a common stock over the years depends chiefly on the earning power and the dividend payments”
Benjamin Graham, Security Analysis
“The value of a business is the cash it’s going to produce in the future.”
Warren Buffett
So as an investor creating valuation models (like Buffett’s “secret” formula for example), your primary focus should not be Price ratios or Margins, but really:
- Future probable growth
- Competitive moat (to sustain future growth)
Everything else we learn is an attempt to help you decide those two things above, such as:
- High ROIC, which goes hand-and-hand with high margins
- Management quality, and their prudent allocation of cash flows
- High free cash flow yields, which allow for high allocations of cash flows
- High historical growth, which can indicate a superior competitor and/or growing market
The list can go on-and-on and I should really digress at this point.
Bottom line: know your business, the industry it’s in, and its competitive position… and the best way of doing that is by reading the company’s 10-k, and the 10-k of its competitors.
At least, that’s what Warren Buffett said to do anyways. I’m inclined to believe him.
