“Price is what you pay. Value is what you get.”
The price-to-book ratio remains a top valuation metric for certain companies like banks, insurance companies, or railroads.
Numerous variables influence the choice to purchase a certain stock. Of course, the first factor is how well the underlying business does. Equally crucial is determining whether the stock price makes sense on its own.
We can estimate stocks remaining overvalued and ready to tumble if the price is too high, with an investor losing money. But, if the stock remains undervalued or priced too cheap, they could profit big-time.
How, then, can you tell?
A company’s price-to-book ratio, or P/B ratio, offers one approach. It is a fast indicator that assesses a stock’s market price, and we can use it to compare with other stocks in the same industry. The P/B ratio might indicate whether the price per share is appropriate, below its fair value, or stupidly expensive.
In today’s post, we will learn:
- What is the Price to Book Ratio?
- How Do You Calculate the Price to Book Ratio?
- What does the Price to Book Ratio Tell Us?
- What is a Good Price to Book Ratio?
- Limitations of the Price to Book Ratio
- Price to Book Example Using Berkshire Hathaway
- Investor Takeaway
Let’s dive in and learn more about the price-to-book ratio.
What is the Price to Book Ratio?
A financial valuation statistic, commonly known as the Price to Book Ratio, is used to assess how a company’s current market value compares to its book value.
The current price of all outstanding shares represents the market value (i.e., the price the market believes the company is worth). The amount that would remain after the company sold its assets and settled all of its debts is known as the book value.
The balance sheet’s book value, equivalent to the company’s net assets, is calculated. In other words, the ratio assesses how a company’s accessible net assets stack up against the market value of its stock.

The price to book ratio is popular among the value investing crowd because it can help investors find undervalued companies. The nature of the ratio allows investors to quickly sort through different companies in the banking industry, for example.
Because of the nature of the ratio, we need to use it in industries or sectors where we can leverage it to our best use. For example, the price-to-book ratio will not work well in the tech world.
How Do You Calculate the Price to Book Ratio?
The price-to-book ratio, or P/B ratio, can be determined by dividing a firm’s share price by the book value per share, which is the sum of its assets less any liabilities. Using the ratio can be helpful for a detailed stock examination. Remember, the balance sheet equation of assets minus liabilities equals shareholder equity. A cheat to calculate the ratio would use shareholder equity as a quick way to determine book value.
The formula for calculating the price-to-book ratio is:
P/B Ratio = Market Price per share / Book Value Per Share

We will use Ally Bank as our example. We use the following three steps to find the different inputs:
- Calculate the book value, which we do by subtracting the company’s liabilities from its assets. We have two means to determine these numbers. One, use the company’s financials on sec.gov or bamsec.com, which will have the information on Ally’s balance sheet. Or, we can use your favorite financial websites, such as stratosphere.io or tikr.com. All of this will give us Ally’s book value.
- Find Ally’s book value on a per-share basis. We can do this by dividing the above book value by outstanding shares. We can find outstanding shares on the company financials or financial website (most updated).
- Divide the company’s current stock price by the book value per share we determined above.
Let’s put this all together.
- Current market price = $34.95
- Shares outstanding = 341 million
- Total assets = $185,703 million
- Total liabilities = $171,719 million
Now, we can do some simple math.
Book value per share = (185,703 – $171,719) / 341 = 41
Now, to determine the price-to-book ratio, we divide the current market price by the book value per share, which equals:
P/B Ratio = $34.95 / 41 = 0.85
Now, what does this tell us about Ally? It could tell us Ally is selling for less than its value. Or it could indicate something fundamentally wrong with the company.
As with most ratios, it will depend on the industry or sector and will vary. The price-to-book ratio also indicates what shareholders would receive if the company went bankrupt and how much investors pay for the equity.
What is a Good Price to Book Ratio?
When deciding if a company is inexpensive and hence a good investment, it remains challenging to pin down a precise numerical value for what constitutes a “good” price-to-book (P/B) ratio. By industry, ratio analysis can differ. In some industries, a favorable P/B ratio could be unfavorable in another industry.
So, as with much of the investing world, it depends.
It is useful to establish some broad parameters or a range for P/B value before considering other elements and valuation metrics that help to assess the P/B value more precisely and project a company’s growth potential.
The chart below offers a good snapshot of different industries or sectors you can use for reference. I use them for screening for:
- Banks
- Insurance companies
- Railroads
- Energy
- Utilities
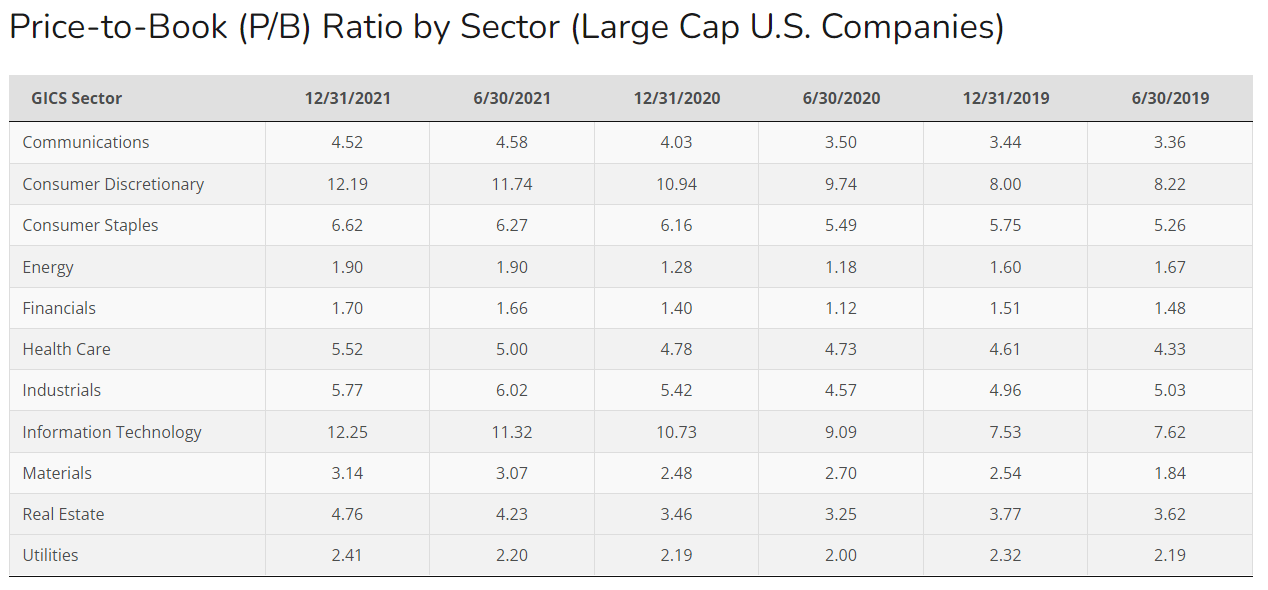
Graph courtesy of siblis research.com
Value investors have long preferred the P/B ratio, which market experts often use. Historically, any figure below 1.0 remains a good P/B for value investors, indicating a possibly undervalued stock. Value investors often use equities with a P/B value below 3.0 as their benchmark.
What Does the Price to Book Ratio Tell Us?
The P/B ratio illustrates the market’s value on a company’s stock compared to the equity’s book value. The market value of a stock is an indicator of future cash flows for a company.
The book equity value is an accounting metric based on the historical cost principle. It considers previous stock issuances, profits or losses, and share buybacks and dividends to reduce it.
The price-to-book ratio contrasts the market value and book value of a corporation. We calculate Ally’s market value by dividing its share price by the total number of outstanding shares. The net assets of a firm are its book value.
In other words, the value left over after a corporation sold all of its assets and settled all of its debts would be the company’s book value.
For investors looking for growth at a fair price, the P/B ratio offers a useful reality check. We can compare the P/B ratio to return on equity (ROE), a dependable growth metric. Large differences between the P/B ratio and ROE frequently alarm businesses. Low ROE and high P/B ratios are commonly present in overvalued growth stocks. A company’s P/B ratio ought to increase if its ROE is increasing.
Limitations of the Price to Book Ratio
Price to book is only effective for assessing specific kinds of businesses. The price to book ratio of a company may be unfavorably high if most of its assets are intangible, as with many technological businesses. For instance, the software juggernaut Microsoft trades for more than ten times its book value.
Price to book, however, can be helpful for organizations that require a lot of capital, like banks.
By itself, a P/B ratio analysis doesn’t reveal much.
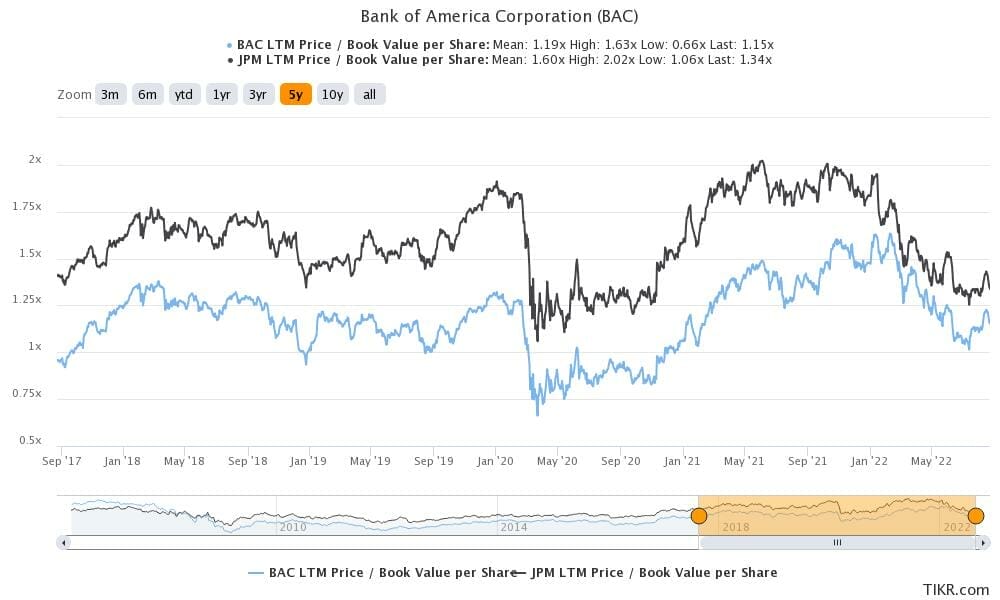
In addition to profitability measurements like return on equity (ROE), you should use it to obtain a more comprehensive picture of a company’s valuation. For instance, Bank of America (BAC) has had a lower price-to-book multiple during the past five years than JP Morgan Chase (JPM). The lower price-to-book ratio does not necessarily imply that Bank of America is “cheaper,” though. In actuality, JP Morgan has continuously had a greater ROE than Bank of America.
From a different angle, poor performance can result in lower P/B ratios because the market value (the numerator) ought to logically drop.
Price-to-book ratios less than 1.0 don’t offer evidence that a company remains undervalued (and is an opportunistic investment).
Instead, a low P/B ratio may be a “red flag” for issues with the company that could cause the value to decline in the future.
Companies with P/B ratios well above 1.0 may reflect recent strong performance and a more upbeat assessment of the company’s prospects by investors.
Before making an investment decision, a closer examination is still necessary. Lower-end P/B ratios can indicate that a firm is cheap, and P/B ratios on the upper end can indicate Ally remains undervalued.
Price to Book Example Using Berkshire Hathaway
Berkshire Hathaway, Warren Buffett and Charlie Munger’s business, offers the perfect opportunity to discuss the price-to-book ratio.
Berkshire generates revenues from multiple different businesses, for example:
- Insurance
- Railroads
- Utilities
- Energy
- Retail
- Investments
These different revenue streams make a conglomerate like Berkshire a challenge to value. Because of how they operate, insurance doesn’t allow for the traditional discounted cash flow model, and the railroads, utilities, and energy offer asset-heavy business models.
The biggest challenge of the investment portfolio is currently at a cool $327.6 billion. Most of the investment portfolio doesn’t turn over much, so the revenues generated from the portfolio to dividend income received from Apple, American Express, and others within the portfolio.
We use the total assets, total liabilities, outstanding shares, and current market price to calculate Berkshire’s price-to-book ratio.
Berkshire’s total assets of $909.8 billion include:
- Equity portfolio – $327.6 billion
- Cash & equivalents – $101.3 billion
- Property, Plant & Equipment – $156.7 billion

The liabilities side of the equation for Berkshire includes debt for utilities and railroads, along with balances held for the insurance portfolios. The total liabilities on the current balance sheet for Berkshire equals $440.2 billion.
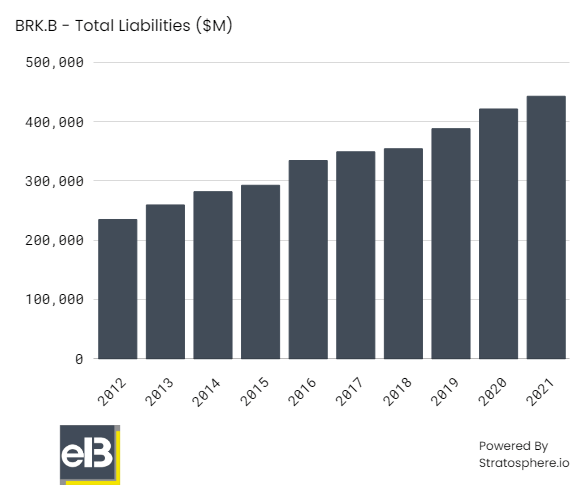
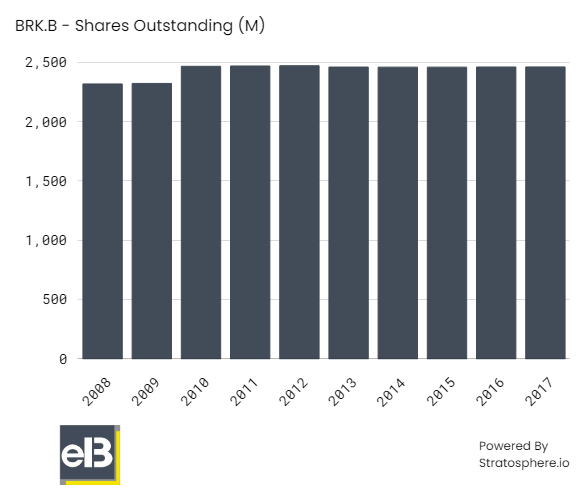
And then, we will divide the difference between the total assets and liabilities by the shares outstanding of $2.2 billion.
The calculation for Berkshire’s current book value per share ratio equals:
Book value per share = ($909,860 – $440,207) / 2,205 = 212.99
Now, we divide the book value per share by the current market price of $292.49, which gives us:
P/B ratio = $292.49 / $212.99 = 1.37
To determine if the price-to-book ratio tells us if Berkshire remains cheap or not, we should compare it to others in similar industries.
For example, others in insurance, railroads, energy, and utilities:
- Progressive – 4.80
- Swiss Re – 1.5
- United Pacific Railroad – 11.69
- NextEra Energy – 4.74
- Brookfield Energy – 3.83
The comparisons show that Berkshire remains undervalued compared to others in their sector.
If we dig a bit deeper, we see that Berkshire also appears undervalued among similar industries.
- The energy of 1.9 > Berkshire’s 1.37
- Financials of 1.7 > Berkshire’s 1.37
- Industrials of 5.7 > Berkshire’s 1.37
- Utilities of 2.4 > Berkshire’s 1.37
Next, we can look at the company’s longer-term price-to-book ratios:
- 2018 – 1.43
- 2019 – 1. 29
- 2020 – 1.19
- 2021 – 1.29
- TTM – 1.37
Over the last ten years, Berkshire’s average price-to-book ratio equals 1.32.
The last indication of the undervaluation of Berkshire: in the old days, Buffett stated he would buy back shares when the price to book fell below 1.2. In more recent interviews, he said he would buy back shares when it provided the most value for shareholders and when the company was selling below fair value.
In 2020 and 2021, Buffett spent over $51 billion on share repurchases, and for the first half of 2022, he spent an additional $5 billion.
Buybacks have become a large part of Buffett’s actions to return value to shareholders. As he continues to reduce the share count and the company continues excelling, he offers us additional value from our shares with each share he buys back.
Below is a quote from the 2021 shareholder letter outlining the power of buybacks related to their ownership of Apple (bolded emphasis, mine):
“Apple – our runner-up Giant as measured by its yearend market value – is a different sort of holding. Here, our ownership is a mere 5.55%, up from 5.39% a year earlier. That increase sounds like small potatoes. But consider that each 0.1% of Apple’s 2021 earnings amounted to $100 million. We spent no Berkshire funds to gain our accretion. Apple’s repurchases did the job. It’s important to understand that only dividends from Apple are counted in the GAAP earnings Berkshire reports – and last year, Apple paid us $785 million of those. Yet our “share” of Apple’s earnings amounted to a staggering $5.6 billion. Much of what the company retained was used to repurchase Apple shares, an act we applaud.”
Investor Takeaway
A stock’s price-to-book ratio, compared to others in its industry or, occasionally, the market as a whole, might reveal if it is a good investment. It can tune out speculative static that is now distorting prices up or down by focusing on fundamentals (the book value) relative to the share price. Over time, we can use the P/B ratio of a particular firm to predict whether it will perform better or worse in the future.
But the price-to-book ratio remains one of the many tools in investors’ toolboxes when valuing a company. We must do all the required analysis before assuming one ratio will tell us all we need to know.
The price-to-book ratio has many good qualities and offers a quick, easy way to screen for investment ideas and as a comparison tool with others in similar industries.
But it’s not perfect, and it has flaws such as ignoring debt, the impact of intangibles, and the rise of investments occurring on the income statement, such as R&D expenses.
And with that, we will wrap up our discussion regarding the price-to-book ratio.
Thank you for reading today’s post; I hope you find something of value. If I can be of any further assistance, please don’t hesitate to reach out.
Until next time, take care and be safe out there,
Dave
