The price to earnings valuation method is a simple and quick way to get an idea about how cheap or expensive a stock generally is.
Like any tool or framework, the price to earnings (or P/E) ratio is not a perfect estimate of valuation and has its drawbacks. The P/E is useful as a starting point, but should not be the sole reason to buy a stock.
With that in mind, let’s dive into the basics and nuances of price to earnings.
Basics: Why Does Price to Earnings Matter?
Over the long run, stock prices tend to follow earnings.
This is because in a free market, the primary purpose of companies over the long run is to turn a profit, and investors purchase ownership stakes in a company to get a claim to those profits.
I’ll let legendary investor Peter Lynch, who had among one of the best track records in the stock market of all-time, summarize it better than I can:
“I can’t say enough about the fact that earnings are the key to success in investing in stocks. No matter what happens to the market, the earnings will determine the results.”
It simply comes down to the fact that over the long term, consistent earnings are the only way a company can invest in future growth and return money to shareholders sustainably.
You can’t have a valuable company in the future unless it records earnings, “profit”, eventually.
And the Price to Earnings valuation method is a great shortcut to quickly seeing what a company’s valuation compared to its earnings is; in other words, how valuable that the market thinks the company is today compared to its current earnings power.
Basics: What is a Price to Earnings (P/E) Ratio?
Comparing companies based on their P/E multiples is a great way to get an apples-to-apples comparison on stocks of any size.
This is because it looks at two metrics that every company shares:
- Price
- Earnings
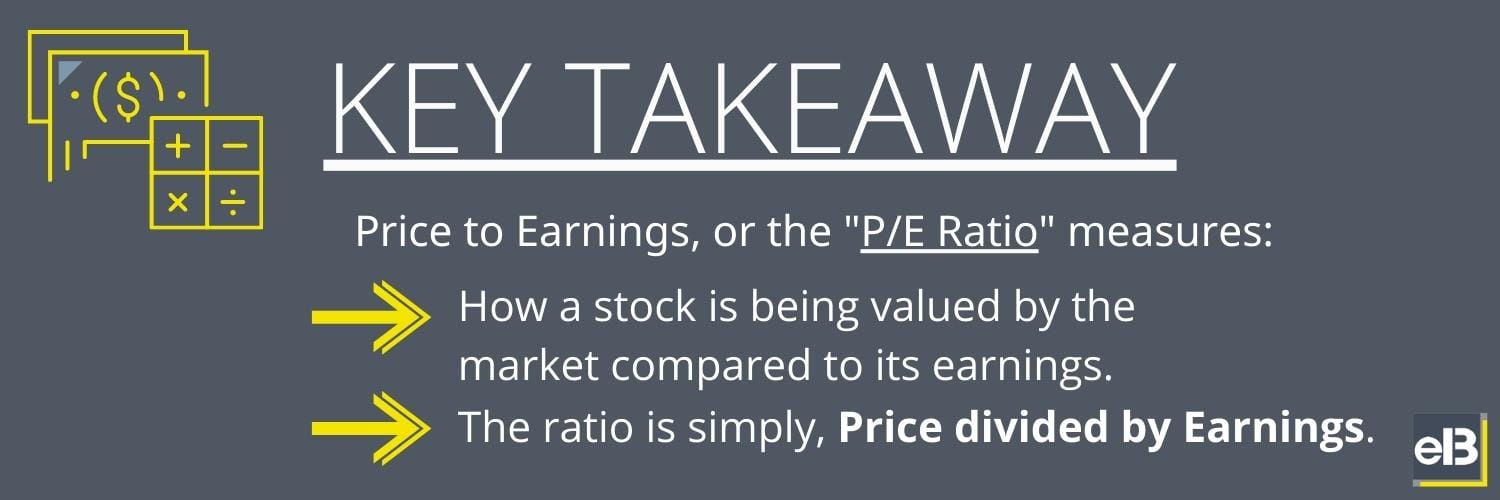
The price to earnings ratio is simply, Price divided by Earnings.

Remembering that we need to compare price and earnings on an apples-to-apples basis, we need to understand that there are two ways to present both price and earnings:
- Per share
- Total
A share of stock represents part ownership of a business. Each share is a fractional ownership of a business.
Any company can be split into any number of shares (“shares outstanding”).
You can buy any amount of shares to correspond to the amount of fractional ownership you want in the company. Each share can be purchased at the “share price”. And the amount of earnings of the company attributed to that fractional ownership stake is called “earnings per share”.
The total value that the stock market is assigning to a company is called “market capitalization”, which is calculated by taking the shares outstanding and multiplying it by the share price.
You can compare the total price, “market capitalization”, of the company to its total earnings to get the price to earnings ratio—you can do the same with share price and earnings per share.
In summary, P/E or Price divided by Earnings can be calculated either as:
- Share Price / Earnings Per Share
- Market Capitalization / Earnings
A higher P/E ratio means that a stock is being valued at a higher multiple to its earnings, and is generally considered more expensive.
A lower P/E ratio means the market is valuing that stock lower compared to its earnings; as an investor you are “getting more” earnings on that stock at its price multiple today.
This P/E ratio can be a great gauge for how bullish or bearish the stock market is on a particular stock and its future growth prospects.
How to Use the P/E Ratio to Value a Stock
Investors tend to use ranges of P/E ratios in order to make determinations on the general valuation of a stock.
The P/E Ratio of a stock on its own tells us nothing about the value of a stock (unlike a DCF valuation which gives you an absolute intrinsic value per share of a company); you have to compare it to another P/E ratio to give you a sense of a value.
This isn’t the worst thing in the world, at the end of the day, the value of anything is generally determined based on comparisons to something else.
For example, $5 today could be a fantastic price for a cheeseburger meal if the average price is $10-$20, while 40 years ago, $5 for a cheeseburger meal might’ve been expensive if the average price at the time was $3.
With Price to Earnings multiples, the most common comparisons are:
- Historical to the market
- Historical to itself
- Vs the Market
- Vs peers
1— Comparing a P/E multiple of a stock today to historical P/E’s could happen on a general level or individual level.
One commonly used historical P/E ratio is the average P/E ratio of the stock market over many decades; depending on the time period this was around 15-17 or lower.
So, an easy shortcut to the expensiveness of a stock could be to compare its P/E ratio to that 15-17 historical average P/E of the stock market. A P/E above or below that range would be expensive or cheap.
2— Another common comparison investors will use is a stock’s current P/E to its historical average P/E.
Let’s say that the stock market has always priced Visa (ticker: $V) at a higher P/E multiple because it is widely accepted that the company has a superior business model.
Buying Visa’s stock at a P/E ratio of 25 might not be interpreted as expensive for an investor who sees that Visa has always traded around a P/E ratio of 35-40.
If the company’s business model can continue to generate above average growth over the long term, its above average P/E ratio might not be considered expensive, and the 25 P/E price point might have actually been cheap when the market prices that stock at a 35-40 P/E multiple again.
3—Similar to #1, investors will tend to determine whether a stock is cheap or expensive by looking at the average P/E of the stock market today and comparing it to a stock’s P/E today.
This can be a great strategy, especially for the type of deep value investors that are trading in-and-out of cheap stocks, because of a concept called “mean reversion”.
Mean reversion says that the P/E of stocks tend to converge towards the average.
In other words, today’s winners become tomorrow’s losers, and vice versa.
This idea can be largely attributed to competition, which in a free market will naturally eat at profits (or flee for the hills in unprofitable industries).
Studies have shown that mean reversion is very real in the stock market (read Toby’s Acquirer’s Multiple for a good example), but as goes with all things business… it depends.
A strategy based on buying cheaper than market average P/E ratios can be a horrible strategy for a long term buy and hold strategy, as it can fill up your portfolio with some of the worst businesses, or not. It all depends on how you use it; this is just another example of how investors will compare P/E multiples.
4—When investors compare a P/E multiple to its peers, it means they will look at the P/E ratios of a company and the companies that directly compete with it.
In general, you’ll tend to see the better (or fastest growing) businesses in an industry with the higher than industry average P/E multiples, because it is expected that these companies will exhibit better than industry average earnings performance into the future and over the long term.
It goes back to that idea from #2 with Visa: a better business might not always be expensive if the actual future performance warrants it.
But that said, buying a stock with a lower than peer average P/E can also be a great decision if the stock market is being overly pessimistic on a company (as it has proven to be many times in the past), or if that business’s prospects improve.
What the P/E Ratio Says About Market Sentiment
Generally the higher the P/E ratio, the higher the expectations assigned to a stock. Companies like Amazon and Netflix have grown at insane levels for long periods of time, and so they have traded at very high P/E ratios.
However, since the expectations were already high on these companies, their stocks didn’t always see explosive gains despite explosive growth within the business.
In the industry, this is called being “priced in”.
Because the stock market is future-looking, stocks are priced based on what Wall Street thinks a company will do, oftentimes much more than what a company has already done.
So, for a stock with a higher P/E, the market expects above average business performance, and for lower P/E’s the market expects below average results.
Stocks and their P/E multiples will tend to move based on changes of those expectations.
It’s these expectations and changes in expectations that can make buying lower P/E stocks a good strategy for value investors.
The problem with high P/E stocks is that the market sets high expectations on its growth. This can mean that even great performance can cause the share price to crash. As we should all know, great performance in the business world can be a tough thing to achieve. Because of this, the odds are often against a stock with a higher than average P/E ratio, because success is not easy.
On the flip side, stocks with low P/E’s can often be a great indicator of value, because they just have to perform a little better to see higher future gains.
If a stock has already disappointed, the business just has to disappoint a little bit less, which can be much easier than achieving impossibly high results.
But be careful.

Like everything to do with the price to earnings valuation method, these are all just general ideas and depend on the specific business involved.
What Are the Main Problems of Using P/E Ratios for Valuation?
Because the P/E ratio just paints stocks with a broad brush, it ignores the business realities behind the stocks involved.
The economy is so complex with so many moving pieces, and winners and losers in varying degrees all across the spectrum. Saying a stock is cheap or expensive without looking at how those earnings are actually generated can be a very dangerous way to invest.
Some businesses actually do have it easy because they are simply great, all they have to do is not derail the gravy train.
For example, a company like Paychex gets a percentage of its customers’ growth without much effort—as payroll needs grow, so do the fees to Paychex, and so it grows alongside the businesses it serves.
Other businesses might have to work much harder to earn sales and profits, and might be engaged in a race to the bottom which leads to no profits for any of those businesses.
For example, take any number of technology hardware companies (besides Apple and its legendary brand); TVs are a great example of products whose prices continue to grow lower, squeezing the profitability of those companies and making it very hard for them to grow over the long term.
Then there’s how you apply a price to earnings valuation.
You have to be careful depending on these P/E ratios to determine the attractiveness of a stock’s price because it can be a short-sighted endeavor.
Because of the power of compounding, buying a stock with a high P/E ratio might actually be a great investment if the “earnings outgrow the valuation”.
I don’t know how else to describe this but with a simple math exercise.
From my blog post on growth vs value:
Taking two examples of a stock with earnings of $1,000: one is trading at a P/E of 20 ($20,000) and one at a P/E of 10 ($10,000). Now we’ll grow stock A’s earnings at 20% and stock B’s earnings at 10%. Then, after 10 years, we’ll take year 10’s earnings value for both stocks and multiply both by 15 to account for mean reversion. Which stock does better?
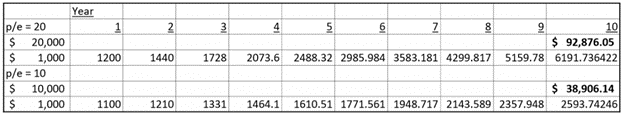
I was very surprised to see that the higher grower did much better than the lower grower even though the lower grower got the mean reversion boost.
That’s the power of compounding at work.
If you’re a long term investor, it might make more sense to buy the stocks with better businesses even at higher than average P/E ratios because of this compounding effect.
But you have to be careful with the degree that you apply this, the math behind a stock with a P/E of 100 is much different than one with a P/E of 35. The degree of expensiveness of a stock and its actual growth can make a huge difference in an investor’s final performance.
Along with that, investors tend to become overly optimistic on a company’s true future growth potential.
The Amazon’s and Netflix’s of the world are the exceptions and not the rule to growth track records. Statistically speaking, you are likely to find companies with future growth in the 5%-10% per year range;in fact, the odds are overwhelmingly in the favor of that reality.
Investor Takeaway
Learning about stock valuation is a journey, not a destination. You can’t expect to become a valuation master overnight.
That said, understanding the Price to Earnings ratio is a valuable way to learn valuation.
If you are still beginning in this journey, I’ll recommend what Dave Ahern has recommended many times… think of it like eating a pizza. You don’t want to eat a whole pizza at once; in fact, you probably can’t.
Just learn about valuation a little bit, piece by piece, over time.
As you practice and evaluate businesses more and more, you’ll start to get a better sense of when companies are truly undervalued or overvalued.
The stock market is not an endeavor that anyone ever perfects, partly because the future of businesses are so unpredictable.
But that doesn’t mean you can’t profit immensely from using some common sense in your valuations, and having faith in the stock market over the long term. There’s truly no better way for the average investor to become wealthy than to compound their money in the market for the very long term.
