Updated 3/6/2024
Profit remains the goal of every business worldwide, but how do we track a company’s profitability and compare it to another’s? Profitability margins help answer both questions. Using the three main profitability margins remains the fastest and easiest way to determine a company’s profitability, and the ratios are simple to calculate, too!
Revenue growth is great and what every company strives for, but no company will go anywhere without profitability. Without that, no profits doom a company to failure at some point.
Eventually, all growth companies come to a fork in the road where they have to focus on profitability instead of growing revenue because the law of economics will kick in eventually, and revenue growth will stop. Once a company reaches this level, profit becomes the engine that continues the party for the company.
Learning how to measure and track a company’s profit is easy. You can use those margins to compare your company to others in the same or competing industries and get a sense of how well a company uses the money generated from all those sales.
In today’s post, we will learn:
- What are Profitability Margins
- What are the Three Main Profitability Margins
- How do You Evaluate Profitability Margins
- Profitability Margins by Sectors
Ok, let’s dive in and learn about profitability margins.
What are Profitability Margins?
A company’s most important goal is to make and keep money, preferably returning some of that money to its shareholders through dividends, share repurchases, or reinvesting in the business.
The importance of profitability margins should be obvious; we should know how to analyze the different aspects of the business, how well it uses its resources, and how much income it can generate from its operations.

Learning the different profitability margins and how to use them is an excellent way to gain insight into a company’s operations and how well it retains its profits.
Looking at the bottom line or earnings is tempting, but earnings don’t always tell the whole story and can be misleading.
Profitability margins can provide deeper insights into a company’s efficiency, particularly management control of costs. Unlike ratios like return on assets or equity, profitability margins tell us how much money a company earns from its assets or equity. They tell us how much juice a company can squeeze from its revenues.
Profitability margins are a class of financial ratios used in economic analysis; we have covered several of these ratios in the past, such as return on equity, assets on assets, or invested capital. The above ratios are fundamental to any company analysis because they cover a company’s efficiency in earning money from its assets, equity, or reinvestment.
Profitability margins come in three flavors:
- Gross profit margin
- Operating profit margin
- Net profit margin
We will discuss these in more depth in the next section.
The bonus of ratios is that they allow you to view the company from many different angles and compare those ratios to itself and other companies. In the case of profitability margins, the ability of a company to generate profits from its revenues as a result of its operations.
As we examine the different profitability margins, you will see that each margin peels away a layer of costs associated with a business’s operations, such as taxes, cost of goods sold, interest payments, and so on. All of these factors have a direct bearing on a company’s profitability. If the company cannot control those costs, it will not be profitable in the long run; regardless of the revenue it generates, it will never be able to overcome the increased costs and remain unprofitable.
Now that we understand profitability margins better, let’s look deeper into these margins.
What are the Three Profitability Margins?
As mentioned above, we use three main types of profitability margins to analyze a company’s financial profitability.
Profiability Ratios
Return Ratios
Margin Ratios
Return on Assets
Return on Equity
EBITDA
Gross Profit
Return on Invested Capital
Cash Flow
Operating Profit
Net Profit
The above diagram illustrates the difference between all the profitability ratios and how we can think of the metrics we use to analyze companies. We have discussed all of the above before, except for the next three, which we will discuss. You can find our previous discussions here:
Please refer to the earlier articles if you are unfamiliar with these ratios.
Ok, let’s dive in and discuss the three main profitability margins.
Before we continue, a note: the higher the ratio, the better. We are looking for a company that generates high-profit margins from all levels of its operations.
To help us with our process, we will dissect the profitability ratios of one company to see the different levels of margins and how they affect the company.
The company I would like to use for our examples is Nike (NKE), which has a current market cap of $151.77B and a market price of $97.6.
Gross Profit Margin
The gross profit margin measures gross profit compared to sales revenue. The margin tells us how much profit a company makes considering the costs needed to produce the goods or services the company produces.
The higher gross profit margin shows that the company continues operating more efficiently in its core operations. This efficiency reflects the ability to cover operating expenses, fixed costs, dividends, and depreciation and provide net earnings to the company.
A low gross profit margin tells us that the company has a high cost of goods sold, which can tell that they have poor buying, high labor, low selling prices, low sales, or formidable competition in their niche.
Let’s look at how we can calculate the gross profit margin.
The formula for gross profit margin:
Gross Profit Margin = ( Gross Profit / Net Revenue ) x 100
Okay, let’s use the numbers from the annual reports to calculate Nike’s gross profit margin. Unless otherwise stated, all numbers listed below will be in millions. Also, all formulas for the profitability margins will contain numbers taken solely from the income statement.
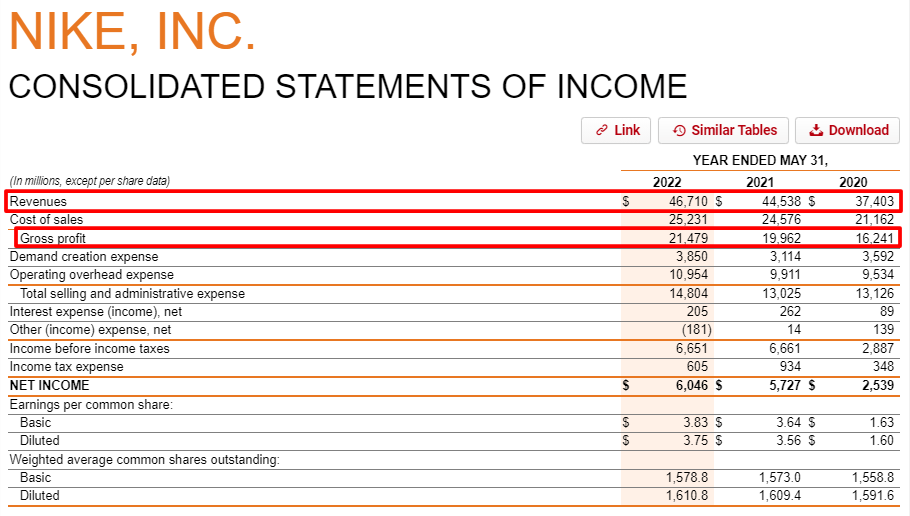
Now that we have our numbers, let’s pull them together from the income statement.
- Revenue – $46,710
- Gross Profit – $21,479
Let’s plug our numbers into the above formula.
Gross Profit Margin = (Gross Profit/Revenue) x 100
Gross Profit Margin = (46,710 / 21,479) x 100
Gross Profit Margin = 45.98%
Pretty simple, huh?
One note: you can find a company’s gross profit if it is not listed on its annual or quarterly reports by taking its net revenues and subtracting the costs of goods or the cost of sales.
Ok, let’s move on and examine Nike’s operating profit margin ratio.
Operating Profit Margin
The operating profit margin looks at the profit earned from business operations before removing interest expenses and income taxes compared to the company’s total revenue.
Businesses with high operating profit margins have a better chance of handling fixed expenses and interest on obligations and surviving economic slowdowns. Another plus is offering lower prices than competitors with lower operating profit margins.
Analyzing management remains a central tenet of finding investable companies, and we can use operating profit margins as a tool to help locate great management teams. Margins are a great way to analyze management. Good management teams manage a company’s profitability and associated costs.
Most companies list their operating income as a line item referred to as operating income, but not all do, as is the case with Nike. To find the operating profit from an income statement, we take Income before income taxes, subtract the Other (income) expense, and add back in the interest expense. Voila, we have our operating income.
The formula to calculate the operating profit margin is:
Operating Profit Margin = ( Operating income / Revenue ) x 100
Now, let’s return to the income statement and find the numbers for our formula.
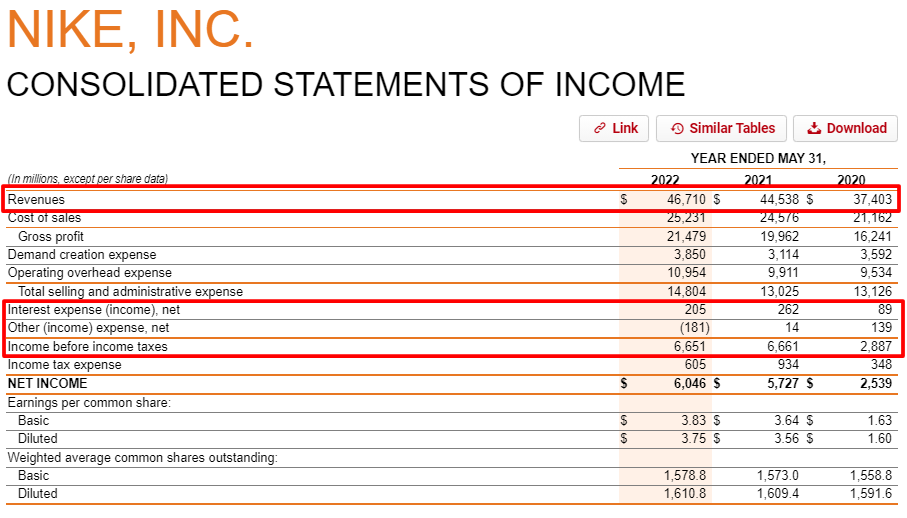
Ok, now let’s calculate our operating income.
Operating Income = Income before taxes – Other Income + interest expense
Operating Income = $6,651 – $181 + $205
Operating Income = $6,675
Along with our revenue from the income statement of $46,710.
And now, we can plug that into our formula for operating profit margin.
Operating profit margin = ( 6,675 / 46,710 ) x 100
Operating profit margin = 14.29%
That wraps up the discussion about operating profit margin; now, let’s move on to the next margin, the net profit margin.
Net Profit Margin
The net profit margin, also known as the bottom line, is the earnings of the company and the result of all revenues and expenses required to operate the company. After accounting for all Items such as taxes, depreciation, costs of goods, labor, administrative, and interest expenses, the resulting number is the total earned by the company for the quarter or year.
The net profit margin operates the relationship between net income and the company’s total revenue. A great reason to consider net profit margin is that it considers all the considerations and tells you how much money the company makes compared to its revenues or sales.
One negative aspect of using the margin is that it can include many one-time expenses or revenues. The “noise” can make comparing to other periods or competitors more difficult.
A great example of this is Nike’s income statement. From 2019 to 2022, you can see revenues and all other costs appear in line with the preceding years, but the net income remains substantially lower for 2020 than in the other years. We can blame this on a past pandemic, which reduced the net income for the period. Compared to the other years, the year’s net income falls significantly compared to the surrounding years.
The drop doesn’t present a huge issue; it is something to be aware of and consider when using ratios for any comparisons.
Let’s return to the income statement to find our numbers for the net profit margin.
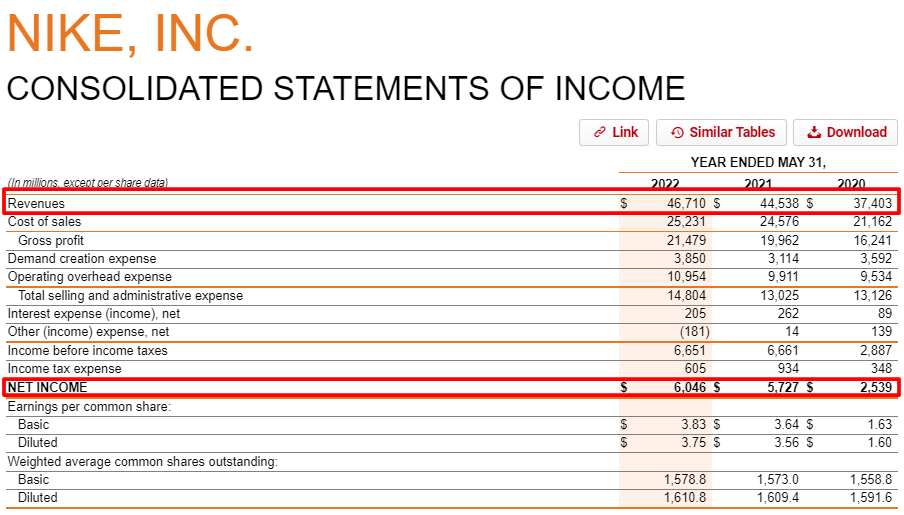
Now, let’s pull our numbers out to plug them into our formula:
- Net income – $6,046
- Revenues – $46,710
The formula for net profit margin is as follows:
Net Profit Margin = ( Net Income / Revenues ) x 100
Net Profit Margin = ( 6,046 / 46,710 ) x 100
Net Profit Margin = 12.94%
Notice how, as we progress down the line from the top of the income statement, the margin percentages get lower as we remove different expenses and charges. Please think of this as your checking account and how, after you take home your paycheck and remove items such as rent, utilities, food, and other expenses, you have your profit to use as you wish.
None of the above formulas are hard, and finding the data to fill them is not difficult either; the biggest trick is knowing how to interpret them, which we will discuss further now.
How do You Evaluate Profitability Margins
Financial ratios are a great place to start analyzing companies, but they don’t always tell the whole story. Using them in financial modeling, such as discounted cash flow, can be a fantastic way to encompass all aspects of the business to determine a company’s strength and health.
Another way to use the formulas to determine financial health and stability is to use them in comparison to itself by comparing past quarters and years. Or by comparing the ratios to other competitors to gauge the strength or health of the company.
To put this into practice, let’s use Nike to compare itself to the past few years and quarters on the three profit margins we just calculated and compare it to some competitors.
First, let’s compare Nike using the above ratios over the last five quarters to see if we can detect any trends.
Quarters | 5/31/21 | 8/31/21 | 11/30/21 | 2/28/22 | 5/31/22 |
Gross | 45.8% | 46.5% | 45.9% | 46.6% | 45.0% |
Operating | 16.2% | 17.3% | 12.8% | 15.0% | 12.0% |
Net | 12.2% | 15.3% | 11.8% | 12.8% | 11.8% |
That is an interesting exercise; a few things pop out when you do it this way. First, there is not a lot of change from quarter to quarter, and secondly, the net profit margin appears to be on a downward trend quarter by quarter.
The big takeaway from doing an exercise like this by quarter is to investigate any good or bad trends further.
Let’s do the same exercise, except using annual numbers to understand trends better.
Years | 2018 | 2019 | 2020 | 2021 | 2022 |
Gross | 43.8% | 44.7% | 43.4% | 44.9% | 46.0% |
Operating | 12.2% | 12.2% | 8.3% | 16.2% | 14.3% |
Net | 5.3% | 10.3% | 6.8% | 12.9% | 12.9% |
That gives us a better overview of the yearly performance and any trends that might stand out further, such as the decline in net profit margin. When looking at the operating profit margin, you can see a slight downward trend, but nothing earth-shattering.
Lastly, let us compare Nike to others in the same industry to get an idea of how its performance of Nike stacks up to its competitors.
The companies I would like to compare to Nike are:
- Addidas (ADS)
- Puma (PUM)
- Skechers (SKX)
TTM | Nike | Addidas | Puma | Skechers |
Gross | 46.0% | 49.9% | 47.3% | 47.9% |
Operating | 14.3% | 7.2% | 8.6% | 8.3% |
Net | 12.9% | 5.6% | 4.7% | 10.4% |
Now, that was interesting. As we can see from the chart above, Nike looks to be the most profitable company in terms of operating profit and net profit margins. As we go through this exercise, you see that Nike lags in the gross profit margin but makes up for it in the last two categories. That would indicate that Nike has superior operating characteristics, which helps it create profit for the company and shareholders.
Whenever analyzing any company, throwing together charts like the above is incredibly enlightening. Comparing numbers to themselves can help you see trends, but company-to-company comparisons are much more revealing.
Using the profitability margins in this manner is the true strength of these margins and helps define the financial strength and health of any company you are analyzing.
Let’s look at a few sectors to understand how to compare profitability margins by sector.
Profitability Margins by Industry
Another way to use profitability margins is to compare them to others in the industry to get a sense of the company’s performance relative to its peers.
Gross Profit Margin
- Oil and Gas Extraction – 37.9%
- Building Construction – 19.7%
- Retail – 34.6%
- Communications – 53.8%
- Food Stores – 27.7%
- Depository Institutions – 73.6%
- Business Services – 57.2%
Operating Profit Margin
- Oil and Gas Extraction – 15.5%
- Building Construction – 7%
- Retail – 7.2%
- Communications – 11.3%
- Food Stores – 2.2%
- Depository Institutions – 43.9%
- Business Services – 2.3%
Net Profit Margin
- Oil and Gas Extraction – 8.7%
- Building Construction – 5.2%
- Retail – 4.7%
- Communications – 3.1%
- Food Stores – 1.5%
- Depository Institutions – 28.4%
- Business Services – (2.1)%
The above is just a sampling of the ratios available for all the industries you want to investigate. I highly recommend you check any company you are analyzing with its peers for a quick reference. I used the website:
Using the above website is a quick, easy way to find comparison information for any company you are searching for and a great way to determine your company’s financial health and strength.
Final Thoughts
As I have previously mentioned, when analyzing a company, we are Sherlock Holmes. We must gather all the clues and put them together in a story that helps us determine the overall health and strength of any company we are analyzing.
The clues we gather help us decide whether that company is worth our investment.
Financial ratios such as the profitability margins like gross profit, operating profit, and net profit help us determine that strength. The formulas themselves are quite simple to calculate, but using them in comparison to competitors is where the margins shine.
As with all formulas and margins, we discuss using them together to form an idea of a company’s investability. We should not use them alone. Rather, they are all clues that can add up to a great investment. In other words, please never invest based on a great gross profit margin alone.
That is going to wrap up our discussion for today.
As always, thank you for taking the time to read this post, and I hope you find something of value on your investing journey.
If I can further assist, please don’t hesitate to reach out.
Until next time.
Take care, and be safe out there,
Dave

Dave Ahern
Dave, a self-taught investor, empowers investors to start investing by demystifying the stock market.
