Research and Development, or R&D, spending is a critical expense for companies looking succeed in the future—depending on which industry that company is in. Watching trends in R&D spending, particularly as a percentage of revenue, can help investors get an idea of how forward thinking a company is being.
R&D spending is a main operating expense which is part of a company’s primary P&L, or income statement.
Generally, an income statement is broken up into the following main components:
- Revenue
- Cost of Goods
- Gross Profit
- R&D Spend
- SG&A (Selling, General, and Admin)
- D&A (Depreciation, Amortization)
- Operating Profit
- Taxes, Interest
- Net Income
You’ll find that the amount of R&D spend compared to a company’s revenues tends to vary greatly depending on their industry.
This makes sense, as a technology firm who depends on innovating its products and services in order to remain cutting edge, will need to spend aggressively to keep its market share.
Compare this to a dependable consumer brand company, who doesn’t need to innovate their product hardly at all and can simply produce the same product each year.
That’s not to say that all high R&D spending companies are poor investments—a high tech company might not need to spend much on marketing at all compared to a consumer-facing brand who doesn’t need to innovate.
How to Best Apply the R&D Spending to Revenue Ratio
It’s all situational, which is why comparing R&D spend to a company’s competitors and historical trends is a much more useful exercise than simply looking at the percentage figure on its own.
Calculating this ratio is quite simple. Although it’s not an official metric, we can use common sense to create our own ratio and compare it across the entire S&P 500 (over 20 years).
R&D as a % of revenue = Research & Development Expenses / Revenue
Note: Keep in mind that as of the writing of this post, early 2021, R&D expenses are currently part of the income statement and are expensed over one year instead of several.
This is because of the accounting standards at this time, though there has been discussions about having the accounting of this metric changed to reflect the fact that much R&D spending is useful over many years of a company’s life instead of just one. The argument is—similar to investing in a long term asset, R&D spending as an expense should be capitalized (depreciated) over several years instead of taking it as an upfront cost and possibly depressing short term earnings.
We don’t know if accounting standards on this will change, but there are ways to account for the effects of R&D spending on the long term health of a company, and watching changes in the percentage of revenue ratio is a great way to do that.
Declining R&D spend over time could indicate a company with a strong competitive advantage if the industry or technology looks matured, or it could indicate a short term focused management.
Increasing R&D spend could signal a fast growing market or industry, or could be reflective of a management who will grow at any cost with little care to the possible negative effects to shareholders.
Trends in R&D spending versus revenue are not good or bad, but should be taken into context and used with other analysis to make intelligent opinions on the data you are presented.
R&D Spending as a Percentage of Revenue Dataset [S&P 500]
That said, let’s dive into the R&D percentages for every company in the S&P 500, categorized first by the average for each sector and then by industry.
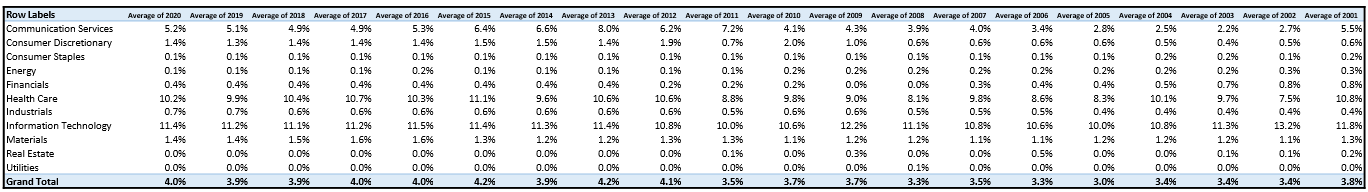
Click to zoomNote: I’ve adjusted this dataset to exclude years where a company had an R&D spending ratio greater than 100%, as these tend to skew the averages greatly. However, these cases were few and far between and had little overall bearing on most of the final numbers.
It should be no surprise that technology is the leading sector for R&D spend, claiming the top spot in every single year examined.
However, you might be surprised to see that healthcare is also high up there on the list, almost matching technology’s 2020 ratio of 11.4% with its own 10.2%.
Looking at deeper at healthcare itself, I was shocked to see that the spending on R&D for this relatively non-cyical sector was actually quite cyclical itself, reaching levels at or below 9% for the years 2011, 2009, 2008, and 2005-2006.
Contrast this to technology, where the stock prices of these companies undoubtedly go through massive downswings and yet the R&D spending percentage remained at or above 10% for every single year examined. Spending was even elevated during 2008-2009, which may be reflective of the lower revenues of the time and/or the perceived necessity of these expenses even if the economy is slumping.
Communication Services and Other Lower Spending Sectors
The final top R&D spender was the Communication Services, no doubt led by big cellular companies such as AT&T, Verizon, and T-Mobile, to name a few.
You can also throw in more “new world” names like Google, Facebook, and Netflix into the mix, which would also naturally have higher R&D spending as they walk the fine line between technology and communication (more like both rather than either/or).
You can see how the average R&D spending percentage ramped up for this sector in key times like 2011 and 2013, only to drop back down again depending on the year.
Another key observation from the numbers is that the 2010s had much higher (basically double) R&D spending ratios than the 2000s had. This might be more indicative of the fact that the lines of communication and technology have started to blur and many communication companies need to have cutting edge technology in order to thrive in their markets.
On the flip side of the high R&D spenders are the zero R&D companies, which are concentrated in Utilities, Real Estate, and most of Energy and Consumer Staples.
For Utilities and Energy, these companies spend large amounts of capital on long term assets (property, plant, and equipment) which are reflected in a free cash flow calculation and take the form of “depreciation expense” in the income statement.
Like mentioned earlier, expenses for long term assets are depreciated over many years instead of one, which can make percentages of this expense lower than R&D which is expensed all at once—but again it depends on the companies examined.
Consumer discretionary, Financials, and Industrials all seem to have cyclical movements in their R&D spending trends which could correspond with boom or bust revenue periods or other outside factors.
With the way that the business world is rapidly becoming digitalized, and companies are moving their infrastructure, supply chains, consumer experiences, and operations to digital—it seems that increasing R&D spend might become a chief priority at many companies to absorb and get ahead of these changes.
However, one interesting exception to that seems to be financials, which has lower spend in the recent years compared to the early 2000s.
That financials would be spending less on R&D instead of more seems to go against what common sense currently dictates, especially as “fin tech” has become increasingly popular the last several years as it steals share from older financial institutions.
Average R&D Spending By Industry Dataset [S&P 500]
Let’s go deeper into the data, this time with industries for the S&P 500 instead of just its sectors:

Note that there were many industries where the total R&D spending percentage was 0%, and I’ve excluded them from this chart. There are still some industries which are appearing as 0.0%, but these are slightly greater than 0% but are just rounded to the first decimal (.0%).
An interesting find indeed—it seems that all of the “hot stocks” in the S&P 500 today are also among the biggest R&D spenders, especially in industries such as Biotechnology, Interactive Media, Semiconductors, and Software.
You can see there are wide disparities in R&D spend percentages depending on the industry, with the high teens very common for the more recent tech/emerging markets, and below 1% or a flat 0% pretty common as well.
Investor Takeaway
While companies spending on R&D can be seen as a great plus for investors as it makes a company’s future look bright, there are some downsides to high R&D spend as well.
Just like with marketing or employee spend, there’s no guarantees that higher expense levels will directly lead to higher profits, or at least produce a positive ROI.
Sometimes more is not always better, and it can be hard to get clarity about that just from looking at the numbers.
At the same time, some companies which have lost their technological lead can have foreboding trends in their numbers for years before the adverse effects come to light, and sometimes it’s directly observable by comparing their R&D spending percentage to competitors.
We can’t possibly know all of the answers when it comes to a company’s R&D, but knowing this context with other industries and the overall S&P 500 can give us some sense when the numbers are completely out of whack.
As it comes down to understanding every moving piece of a business, research a company and building a circle of competence around your knowledge of it can make the difference between profitable investments and losing investments over the very long term.
Because to hold a company for the long term means believing in it even if the market doesn’t, which often happens when a bear market takes hold and a pessimistic environment becomes contagious.
We recommend learning various stock market metrics, and mastering the skill of reading a 10-k, in order to build that confidence which you’ll need when buying and holding stocks.
Look at this as the starting point, not the ending point, of your quest for knowledge and compounded returns.

Andrew Sather
Andrew has always believed that average investors have so much potential to build wealth, through the power of patience, a long-term mindset, and compound interest.
