Updated 2/7/2024
Investing in real estate is one of the classic asset allocations investors must choose, but not everyone has or wants to own physical real estate. So, what other option is there? How about real estate investment trusts, or REITs for short? REITs can offer fantastic returns for all investors with a higher dividend yield than most stocks.
For example, the S&P 500 now offers a roughly 2% dividend yield, whereas finding a REIT offering 5% or higher is relatively simple.
When constructing your portfolio, it is generally the best idea to own assets that are not closely correlated to avoid big hits when particular sectors suffer bigger impacts than others.
REITs allow you to invest in real estate without many of the headaches associated with that asset class, such as finding the property, getting a loan approved, finding renters, maintaining, and more.
REITs are also in many sectors, including healthcare, apartments, industrial, retail, malls, office properties, and storage centers.
Like any new investment, the trick with REITs is discovering the language of this asset class and figuring out how to value a REIT. Like the financial sector, there are some particulars that we need to discover, and once we understand the different metrics, it is much easier to invest in REITs.
In today’s post, we will learn:
Let’s dive in and learn more about REITs and how to value them.
What is a REIT?

According to NAREIT, which is the National Association of Real Estate Investment Trusts, that governs REITs:
“Real estate investment trusts (REITs) own and most often actively manage income-producing commercial real estate. Some REITs make or invest in loans and other obligations secured by real estate collateral. The shares of most large REITs are publicly traded.”
In 1960, Congress passed legislation that allowed the creation of REITs to enable investors to benefit from investing in large-scale commercial real estate.
Investing in commercial real estate through REITs offers many benefits to investors, such as superior dividend yields and long-term share appreciation like any other stock investment. Plus, they allow for additional asset allocation for the investor’s portfolio.
The current yields of REITs are not an accident; in fact, they are by design, as REITs must contribute at least 90% of their net income to dividends. The regulations governing REITs require the distribution of dividends, which leads to much higher dividend yields than others, such as Apple or Microsoft.
One might think there isn’t much chance for the company to reinvest because of the high dividend yields or little to no share appreciation. But REITs have returned annual returns of 10.6% since 1994, whereas the index tracking the returns has seen returns of 10% over the same period.
You might assume that REITs focus solely on commercial real estate ownership, but REITs have a different structure as they are trusts, not corporations.
The difference lies in the structure of the legal entities. Because REITs are trusts, not corporations, they have a different tax structure that is far more tax-efficient for REIT investors.
How does that work?
The Tax Structure of REITs
In exchange for operating as a REIT, the company pays no tax at the organizational level, allowing it to distribute 90%+ of its net income as dividends.
As the structure of REITs is different, the returns the REITs generate need a different take on a tax basis. The returns fall into three different categories:
- Ordinary income
- Return of capital
- Capital gains
The ordinary income tax is 39.6% and is the most straightforward for tax considerations.
Return on capital comes into play when you sell the REIT, and deferred tax enters the chat; you don’t pay any taxes until you sell.
Finally, depending on when you sell the stock, the taxes on capital gains are at either short-term or long-term rates.
Because REITs generate most returns through dividends, the best tax vehicle for them equals retirement accounts. Taxes on dividends are ordinary income, which means that retirement accounts eliminate that negative and make REITs very tax-friendly.
Different Metrics to Use When Analyzing REITs
As I mentioned in the intro, traditional REIT analysis methods don’t work well. Therefore, metrics such as EPS and PE are not useful.

Rather, NAREIT established specific ratios to assess the value of REITs. The metrics we discuss are not GAAP-related, so you will not find them in the accounting rules, but the investing community generally accepts them.
Depreciation remains the main reason for the adjustments made to accommodate REITs. Allowing the depreciation of business assets over time equals a valuable tax benefit. In most instances, the depreciation of the business’s machinery, property, computers, and other items isn’t enough to distort the company’s earnings.
However, all REIT assets are depreciable, as they own real estate properties.
Depreciation remains a major annual tax deduction and helps reduce the REIT’s taxable income. But depreciation doesn’t cost the REIT anything; they have costs associated with the depreciation. It makes sense because while most assets depreciate, real estate usually appreciates, and therein lies the problem.
Instead of using metrics like earnings per share or net income to measure the REIT’s performance, we use funds from operations or FFO. We add back the depreciation expense, which remains the biggest differentiator.
Funds From Operations
FFO, or funds from operations, is the most important REIT-specific metric to understand before investing in REITs. All the others relate to FFO; thus, the focus is on the metric.
Let’s look at a company to illustrate how the funds from operations work.
For our guinea pig, I would like to focus on Store Capital (STOR), a REIT currently in Warren Buffett’s portfolio.

From the chart above, Store Capital calculates our FFO, and if you compare those numbers to the income statement, you will see the same result. Because FFO is a non-GAAP number, it is not included in the income statement, but fortunately for us, every REIT I have studied includes this calculation.
As you can see, the FFO vastly differs from the net income; the FFO for Store Capital shows that the company made almost double the net income.
Also, notice the bottom line item from the chart above, which includes Adjusted Funds from Operations, or AFFO. Think of AFFO as adjusted earnings, which many REITs include to offset any one-time charges or amortization of expenses not associated with operations.
The AFFO is a means of coming to a true picture of how much money the company is making.
FFO per Share
Just like earnings per share, once we have calculated the FFO, we divide that number by the shares outstanding, and we arrive at our FFO per share, which is a better choice to assess the value of a REIT.
Looking at Store Capital, we can see the FFO for 2019 is $441.16, and the current shares outstanding are 230.29. We divide:
FFO per share = $441.16 / 230.29
FFO per share = $1.92
P/FFO
Next is the P/FFO, which is a substitute for the P/E ratio. We use this to compare it to its peers to determine its relative value.
The current price for Store Capital is $27.98, and the per-share we calculated above is $1.92.
P/FFO = $27.98 / $1.92
P/FFO = 14.57
Payout Ratio
As with any company that pays a dividend, we can easily assess the payout ratio of a REIT by dividing the dividends per share by the FFO by share, and voila, payout ratio. Store Capital currently pays a dividend of $1.40 per share.
Payout Ratio = $1.40 / $1.92
Payout Ratio = 0.74 or 74% payout from FFO.
Remember that REITs must pay out at least 90% of earnings. If we look at it from a dividend per share versus earnings per share basis, we get a 121% payout ratio, which seems high but remains historically consistent with the amount that Store Capital has paid over the last five years.
The high ratio for a company like Store Capital would merit some investigation, but I wouldn’t be greatly concerned if it equals 80% to 90%.
Debt-to-EBITDA
REITs carry a lot of debt, but too much debt concerns anyone investing in a REIT. Debt-to-EBITDA offers investors one of the best ways to assess the debt level from an overview level.
The target to look for about this metric is a debt-to-EBITDA of 6.1; anything above that is something to investigate.
Store Capital currently has a TTM EBITDA of $665.2, and the total debt for the latest quarter’s balance sheet equaled $3,393, which consists of all long-term debt.
Therefore, the calculations are:
Debt-to-EBITDA = $3,393 / $665.2
Debt-to-EBITDA = 5.1
We can compare the debt level of the company you analyze to peers to get an idea of how your company performs. Sometimes, looking at numbers in a vacuum is misleading.
Interest Coverage
Interest coverage for a REIT remains important because, as a company with higher debt loads, we must assess how easily it can pay its interest expenses on the current debt. The higher the interest expense, the more impact it has on the company’s cash flow.
Every quarter, the interest coverage is:
Operating income 2020 Q2 = $77.689
Interest Exenses 2020 Q2 = -$41.946
Interest Coverage = (-1 * $77.689) / -$41.946
Interest Coverage = 1.85
Remember, the higher the number, the better because it indicates it can easily handle its debt load. The number will be industry-specific; for example, a tech company might have a much higher interest coverage ratio because they have higher margins and can finance operations via free cash flow.
Credit Rating
The last measure of screening through REITs is examining the company’s credit rating. Why do we do this, you ask?
The ability to borrow money to purchase properties is central to a REIT’s operations, and the stronger the credit rating, the lower the interest rates the company is charged and, thus, lower overall costs.
To find Store Capital’s credit rating, I log into my Moody’s.com account, which is free, and search for Store Capital.
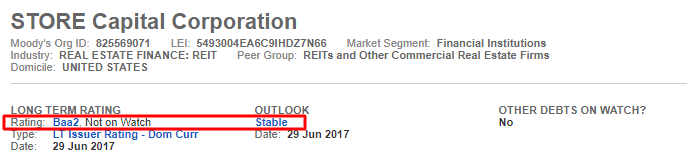
As we can see from the above, Store Capital currently has a credit rating of Baa2, which, according to Moody’s chart, is of high medium grade and has moderate credit risk.
Another great practice is comparing your company to its peers to see how it stands.
Okay, now that we understand REITs and how to assess them, let’s examine the methods for valuing them.
Methods for Valuing a REIT
There are three main types of intrinsic valuation methods available. They encompass models we use for other companies, such as discounted cash flow and the dividend discount model.
The new addition is a method utilized in the REIT world: the Net Asset Value or NAV.
Net Asset Value (NAV)
To use NAV, we need to gather a few numbers.
- Net Operating Income or Gross Income
- Cap Rate
- Overall debt of the company
- Cash and cash equivalents
- Accounts Receivable
- Goodwill
- Other Assets
- Shares Outstanding
- Accounts Payable
- Other Liabilities
Most of this information is on the balance sheet and income statements. For our calculations, I will stay with Store Capital, and we will access the 10-k to calculate the company’s NAV.
A note on the cap rate for Store Capital: the easiest way to determine the cap rate for any REIT is to look at the financial statements on SEC.gov and use the Ctrl-F function, which allows you to search the text for a specific set of words.
To find the cap rate, use the ctrl-F function and type in the phrase “capitalization rate. ” You will find links to that phrase, where we find that Store Capital has a cap rate of 7.9% for 2019.
The rest of the info we will pull from the statements for Store Capital.
- NOI, Net Operating Income – $648.8
- Cap Rate – 7.9%
- Cash & Cash Equivalents – $669.2
- Accounts Receivable – $618.5
- Total Debt – $3,591
- Accounts Payable – $201.4
- Shares Outstanding – 230.3
The process now that we have our numbers is:
- Divide NOI by the Cap Rate
- $648.8 / 7.9% = 8,212.65
- Next, we add the cash and accounts receivable
- 8,212.65 + 669.2 + 618.5 = 9,500.36
- Next, subtract the total debt and accounts payable from our number.
- 9,500.36 – 3,591 – 210.4 = 5,698.96
- Lastly, we divide the above number by our shares outstanding to find the per-share value.
- $5,698.96 / 230.3 = $24.75
That is the process for calculating the NAV of Store Capital; try it out on another REIT as homework.
The above is an overview of the NAV model; I will soon add a more in-depth post about it.
Dividend Discount Model (DDM)
Because dividends are a REIT’s mainstay, it makes sense to approach their valuation using the dividend discount model. I will provide the inputs I am using to arrive at our valuation, but if you are unfamiliar with this model, please check out this link for more details on how to use a DDM.
A Thorough Breakdown of the Dividend Discount Model
The following are the inputs I will use for the model:
- Beta – 1.1
- Risk-free Rate – 0.70
- Risk-premium – 5.79
- Dividend Payout Ratio – 74%
- Retention Ratio – 26%
- Current Annual Dividend – $1.40
- Return on Equity – 6.17%
After plugging the numbers into the model, we arrive at $26.03 per share.
Discounted Cash Flow (DCF)
As we turn to our last valuation model, we will follow the same route as the DDM; I will list out the assumptions I am using to input into the models for the discounted cash flow if you are unsure about this model or would like more info, please follow the link below:
Explaining the DCF Valuation Model with a Simple Example
For our model today, instead of using earnings or free cash flow, we will use the FFO per share we calculated at the beginning of the post.
FFO for REITs equals a version of free cash flow for the sector, which is why it works well for the discounted cash flow model.
Here are the inputs for our model:
- Beta – 1.1
- Risk-free rate – 0.70
- Risk premium – 5.69
- FFO growth rate – 8%
- FFO per share – $1.90
- Terminal rate – 3%
After plugging the inputs into the model, we return $37.02.
I use the discounted cash flow model available on gurufocus.com to make this easier for you. It’s free and gives a ballpark figure.
Now, if we assess our company on the three models:
- NAV value – $24.75
- Dividend Discount Model – $26.03
- Discounted Cash Flow – $37.02
Now, we can compare our results to the current market price, which, as of September 11, 2020, is $ 27.91.
We can see we have a range of undervalued to overvalued companies, but the best way to assess a company’s valuation is to assess it using a range of values.
Never settle for one value and base your investment thesis on that single value; running the company through several valuation methods remains best to see if our value puts us in the ballpark.
Final Thoughts
Investing in REITs offers us a great opportunity to take a bite out of a sector you may not have access to any other way. Of course, we have risks involved with any investment, and the primary risk you face regarding REITs remains the debt load.
As we discussed above, multiple metrics are available to analyze any REIT, and the best part is they remain similar to those we use for other companies.
REITs, like banks, speak a slightly different language; once you understand that language, the sector opens up to you for additional analysis and other investment opportunities.
When valuing the REITs, other than the NAV model, the same rules apply for any other model you wish to use, as long as you understand that the earnings and free cash flow don’t relate the same as Walmart. Once you understand those differences, we can apply them.
That is going to wrap up our discussion today.
As always, thank you for taking the time to read this post, and I hope you find something of value on your investing journey.
If I can further assist, please don’t hesitate to reach out.
Until next time, take care and be safe out there,
Dave

Dave Ahern
Dave, a self-taught investor, empowers investors to start investing by demystifying the stock market.
