Updated – 11/17/23
You might want to know how unemployment affects the stock market. It would seem that logically, high unemployment should lead to a lower stock market.
But, looking throughout history, we’ve actually seen that the relationship between unemployment and the stock market isn’t black-and-white, which may surprise you.
Remember, history often rhymes.
Today’s post will cover the following:
- 4 Headline Stock Market Crashes Through History
- Historical Unemployment Rates and Inflation
- Example: Poor Economy and a Great Stock Market
- Unemployment and GDP Growth
- Economic Super Cycles, Unemployment, and the Stock Market
History can teach interesting things.
Like after the Dot Com crash in the stock market, we saw another crash after a peak in 2007. But while the Dot Com crash really affected technology stocks, the 2008-2009 debacle really hit financials and real estate.
But, history can also be extremely crippling if it closes our mind to the future, rather than opening it.
4 Headline Stock Market Crashes Through History
I think a problem with misconstruing history in the stock market is our nature to hyper-focus on major events and try to extrapolate them into our present reality. Those include:
- The 1929 Panic
- Black Monday Crash of 1987
- Dot Com Bursting 2000-2002
- The Too Big to Fail Crisis 2008-2009
But after looking back at simple unemployment data, I don’t believe that these periods represent tough economic times.
For example, let’s look at unemployment rates through history. I’ll highlight the biggest periods:
- 1930-1941
- 1931: 15.9%
- 1933: 24.9%
- 1937: 14.3%
- 1938: 19%
- 1941: 9.9%
Note that in 1945, the way unemployment was calculated changed. Since 1945, you have to be considered looking for work in order to qualify as unemployed (in other words, not a student or retired or not actively looking for work for any other reason).
- 1970-1971
- 1970: 6.1%
- 1971: 6%
- 1974-1976
- 1974: 7.2%
- 1975: 8.2%
- 1976: 7.8%
- 1980-1985
- 1980: 7.2%
- 1982: 10.8%
- 1985: 7%
- 2009-2010
- 2009: 9.9%
- 2010: 9.3%
Note that unemployment calculations during the COVID-19 pandemic were also calculated differently than ever before, including both temporary (such as furloughs) and permanent unemployment as the same reported headline number. The unemployment numbers for the COVID-19 pandemic were not included in this research for that reason.
Now, let’s line those numbers up exactly to the headline stock market crashes above.
- The 1929 Panic
- Unemployment 1929 = 3.2%
- Unemployment 1930 = 8.7%
- Unemployment 1931 = 15.9%
- Black Monday Crash of 1987
- Unemployment 1986 = 6.6%
- Unemployment 1987 = 5.7%
- Unemployment 1988 = 5.3%
- Dot Com Bursting 2000-2002
- Unemployment 2000 = 3.9%
- Unemployment 2001 = 5.7%
- Unemployment 2002 = 6%
- The Too Big to Fail Crisis 2008-2009
- Unemployment 2007 = 5%
- Unemployment 2008 = 7.3%
- Unemployment 2009 = 9.9%
I find it interesting that we have the 4 major stock market crashes throughout history that really stand out, but only 2 of them were coupled with abnormally high unemployment (1929, 2009).
But, perhaps more surprisingly, it appears that the 1970s and 1980s were actually worse periods for the economy than 2009-2010—even though the stock market performed much better in the former period than in the latter.
Historical Unemployment Rates and Inflation
Going back to the same dataset, let’s look at the same periods above with high unemployment but post the inflation rather than unemployment numbers:
- 1930-1941 inflation
- 1931: -9.3%
- 1933: 0.8%
- 1937: 2.9%
- 1938: -2.8%
- 1941: 9.9%
- 1970-1971 inflation
- 1970: 5.6%
- 1971: 3.3%
- 1974-1976 inflation
- 1974: 12.3%
- 1975: 6.9%
- 1976: 4.9%
- 1980-1985 inflation
- 1980: 12.5%
- 1982: 3.8%
- 1985: 3.8%
- 2009-2010 inflation
- 2009: 2.7%
- 2010: 1.5%
Too much inflation can hurt the economy because it can create civil unrest, as the purchasing power for the average consumer starts to drop.
Note: The historical average for inflation has sat somewhere around 2-3% per year for the U.S. over the very long term, and the 1930s period was known as a dreaded “deflationary” depression, in which too much deflation (the opposite of inflation) can also cripple an economy.
This can have a ripple effect down the line, as reduced purchasing power of the consumer can result in less discretionary spending, which can hurt those parts of the economy and lead to less jobs rather than more. Additionally, investment capital can start to flee a highly inflationary economy, which can devastate an economy over the long term as innovation and growth leaves for a different economy.
Example: Poor Economy and a Great Stock Market
But though high unemployment and high inflation can hurt the economy and its participants, it’s not always necessarily bad for the stock market.
After all, capital that is chasing investments to diversify out of a depreciating currency will naturally find its way into the stock market and push many other assets up as well (such as Gold or commodities). This can be particularly poignant if an economy is a major global player, such as the United States has been over the past century.
Here’s a chart of the U.S. stock market during the time of high unemployment that we have been examining. First, from 1970-1976:
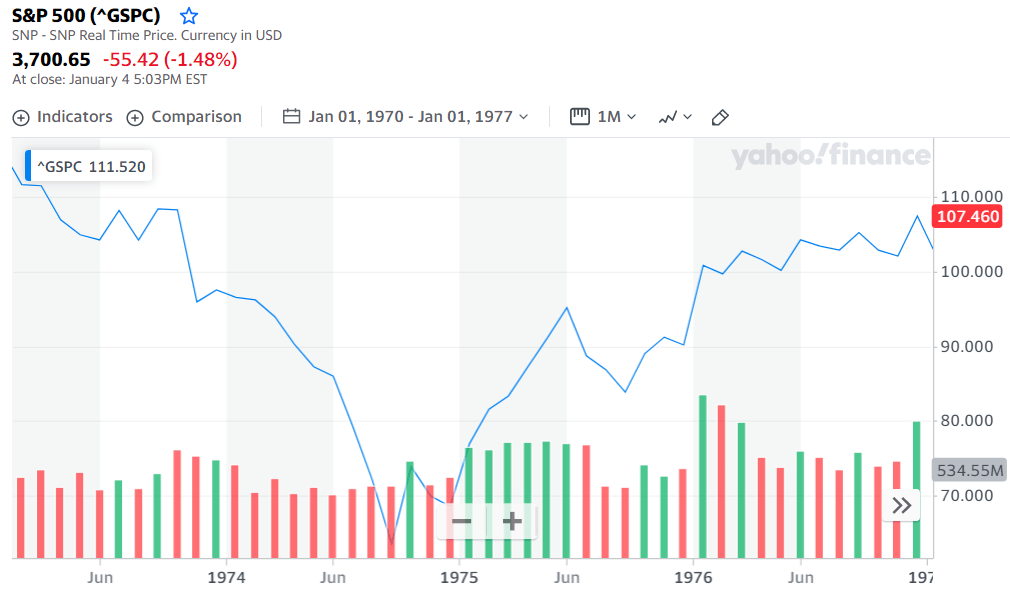
Then, from 1980-1985:
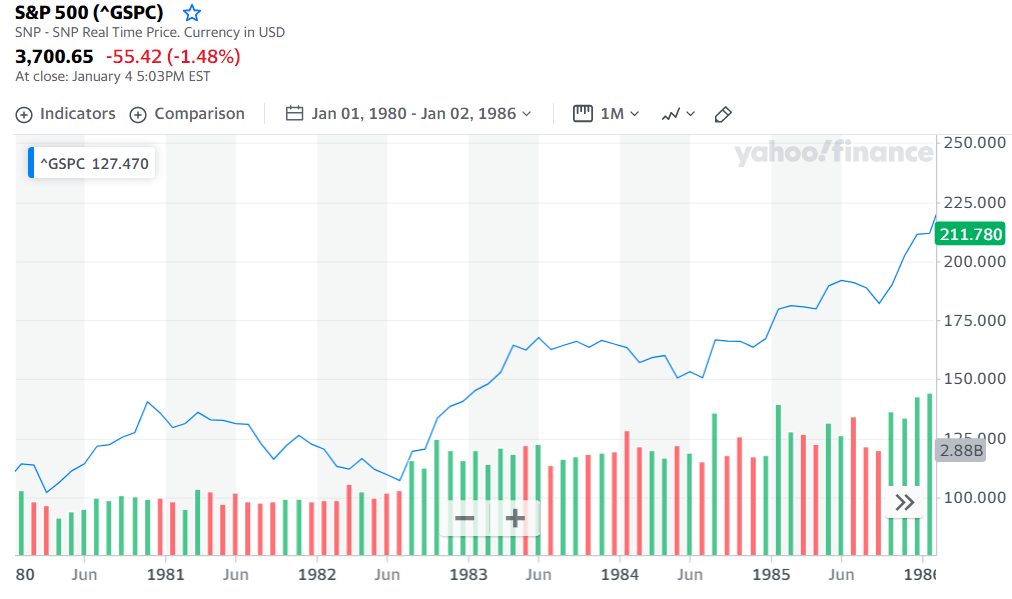
Interestingly, the relationship of the stock market and unemployment during both of these time periods was (counterintuitively) a weak signal. High unemployment did not lead to a lower stock market in one case and did lead to a lower stock market in the other.
Of course, we do know time periods when the relationship between the stock market and unemployment in fact were closely related, as experienced during the Great Depression and the “Great Recession” following the ’08-’09 crash.
Unemployment and GDP Growth
Let’s tie all of this in with actual economic growth, or GDP growth, to see if there’s any relationship between the two and unemployment.
Taking the same periods of elevated unemployment and noting the GDP growth of those times:
- 1930-1941 GDP growth
- 1931: -6.4%
- 1933: -1.2%
- 1937: 5.1%
- 1938: -3.3%
- 1941: 17.7%
After going through a tough period in the early 1930s, the U.S. economy roared back in the late 1930s and early 1940s, with parts of those years accompanied with heavy inflation… but not all.
- 1970-1971 GDP growth
- 1970: 0.2%
- 1971: 3.3%
- 1974-1976 GDP growth
- 1974: -0.5%
- 1975: -0.2%
- 1976: 5.4%
- 1980-1985 GDP growth
- 1980: -0.3%
- 1982: -1.8%
- 1985: 4.2%
These numbers illustrate just how tough of an economic period the 1970s and 1980s was, even though the stock market itself was a roaring place of abundance.
It makes you wonder how a future with this same dichotomy can lead to more social unrest and radical change throughout culture and society.
- 2009-2010 GDP growth
- 2009: -2.5%
- 2010: 2.6%
Economic Super Cycles, Unemployment, and the Stock Market
While we’ve found through this research that there looks to be a weak signal between unemployment and stock market performance, I do want to throw in a wildcard element which can give further food for thought.
I love looking at “big picture” trends of the stock market and the economy to get a sense of how to set expectations for the future.
One of these I covered extensively on the history of interest rates, which suggests that a “golden age” may be upon us in the decade(s) to follow despite (or because) of the ultra-low interest rate period we find ourselves in.
Another theory that has been gripping me lately is that of the big “technological revolution” cycles, as presented by Carlota Perez in the stimulating book Technological Revolutions and Financial Capital.
Each of the different technological revolutions throughout history has been the driver of huge economic progress, which has predictably helped to fix cycles of high unemployment while also providing gains in the stock market during different periods.
Of the concepts I most agree with, Carlota presents the following life cycle of a technological revolution:
- Phase one: Early new products and industries; explosive growth
- Phase two: New industries, systems, and infrastructure
- Phase three: Full expansion of innovation and market
- Phase four: Maturity, market saturation, and slowing growth
Some simple examples throughout history, both in the U.S. and in Britain, really highlight how technological revolutions have led to prosperity and long-term economic supercycles. These include:
- The British Industrial Revolution
- Age of Steam and Railways
- Age of Steel, Electricity and Heavy Engineering
- Age of Oil, the Automobile, and Mass Production
- Age of Information and Telecommunications
Each of the revolutions above, and their accompanying economic supercycles, have followed a predictable curve in which there’s an exponential explosion of growth, followed by consistent growth, and ended by a slowing maturation and evolution into the next stage.
What makes each super cycle so powerful is how a single invention can breathe life into a whole new economy—products, services, industries, companies, and jobs that have never been seen before.
Take the age of oil as an example.
It was the wider spread in the use of oil which enabled Henry Ford to invent the Model T. Once the Model T reached widespread adoption through mass production, all types of new infrastructures needed to be built and were enabled.
With automobiles, you now needed vast networks of roads and highways that needed to be built, as well as oil pipelines to increase production to meet the much higher demand.
Soon, that evolved into commercial airplanes and airports’ universal electricity… which then led to worldwide analog telecommunications like the telephone, telex, and cablegram, and all of the infrastructure required to build those out…
A huge wave of prosperity, innovation, and productivity replaced many “old ways” of doing things (telegraph, steam engines) ,and each super cycle required predictable components of destruction and creation—in long, interconnected phases.
Follow the Economy, not the Stock Market
Where I disagree with Perez slightly is in the timing of some of the revolutions, where I believe the invention of oil in the 1880s marked the start of a revolution (rather than the automobile) and the invention of the transistor radio in the 1940s marked the start of another, and the invention of the internet and world wide web (1989) marked the possible follow-up.
But what we saw at the dawn of each new revolution was a time of economic hardship—which seems to sometimes correlate with stock market troubles but sometimes not.
If we go back to our examples and tie this whole thing together, it could’ve been the troubles of the Great Depression (1930s, 1940s) which led to the new revolution propelled by the transistor radio (which revolutionized consumer electronics).
And then it could’ve been the social unrest and economic hardships of the 1970s and 1980s which bred the seeds for the internet, which arguably set us up for one of the greatest “golden ages” of all time.
Perez saw that in each technological revolution, there was a painful period of destruction of the old paradigm, through not just technology but also with financial and societal structures, and this brief research showing the economic difficulties of the 1970s and ‘80s could also confirm that.
Investor Takeaway
All of this to say, that pointing directly to unemployment and calling it a good or bad time to invest in the stock market is probably not a great strategy.
While there are times that high unemployment correlates with a bad stock market, there are also times where the opposite is true.
That’s why it’s essential to focus on the basics of the stock market and good investing rather than the major headline economic data.
None of us have a crystal ball.
But we can all work to understand the inter-workings of the stock market and investments better, which is why the historical relationship with unemployment and the market is enlightening, but its practicality also has its limits.

Andrew Sather
Andrew has always believed that average investors have so much potential to build wealth, through the power of patience, a long-term mindset, and compound interest.
