Finding the value of a company matters a great deal; some would argue that it remains the single most important item on anyone’s checklist. Figuring out how much the company is worth or its intrinsic value will help you determine your price and what kind of long-term return you might achieve.
Using a discounted cash flow model, or DCF, is one of the more common styles of determining that value, but we have another option: the reverse DCF.
I like using DCF models to determine the company’s value, but the DCF has pros and cons, just as we do for any model. Some make DCFs sound like a terrible waste of time, but they aren’t as terrible as some think. As long as you stay aware of the shortcomings, having a DCF is a valuable tool.
The reverse DCF uses many of the same inputs required for a DCF, but it eliminates some of the variability in the DCF.
In today’s post, we will learn:
- What is a Reverse DCF?
- Problems with a Discounted Cash Flow
- How to Value a Stock with a Reverse DCF Using Examples
Let’s dive in and learn more about using a reverse DCF.
What is Reverse DCF?
If you have read through an analyst’s report, you will most likely come across a valuation method known as a discounted cash flow. Using a DCF requires you to estimate future cash flows of the company, then apply a discount rate you think is appropriate for the company’s risk level, all of which lead you to a “precise” valuation or target price for the company.
One of the problems with using a DCF is that it requires us to use a healthy dose of guesswork to determine the growth of future cash flows, along with the discount rates required to guess at the company’s risk level.
We have a solution to this guesswork problem: working backwards by utilizing a reverse DCF. Instead of projecting future cash flows, the reverse DCF takes the current share price and works backward to project how much cash flow would be required to generate its current valuation. Once we have determined the possible cash flows, we can determine if the price is reasonable.
Reverse engineering the DCF allows the investor to remove some uncertainty. The reverse DCF starts with the price, which we know from any stock ticker, and removes the doubt of projecting future cash flows.
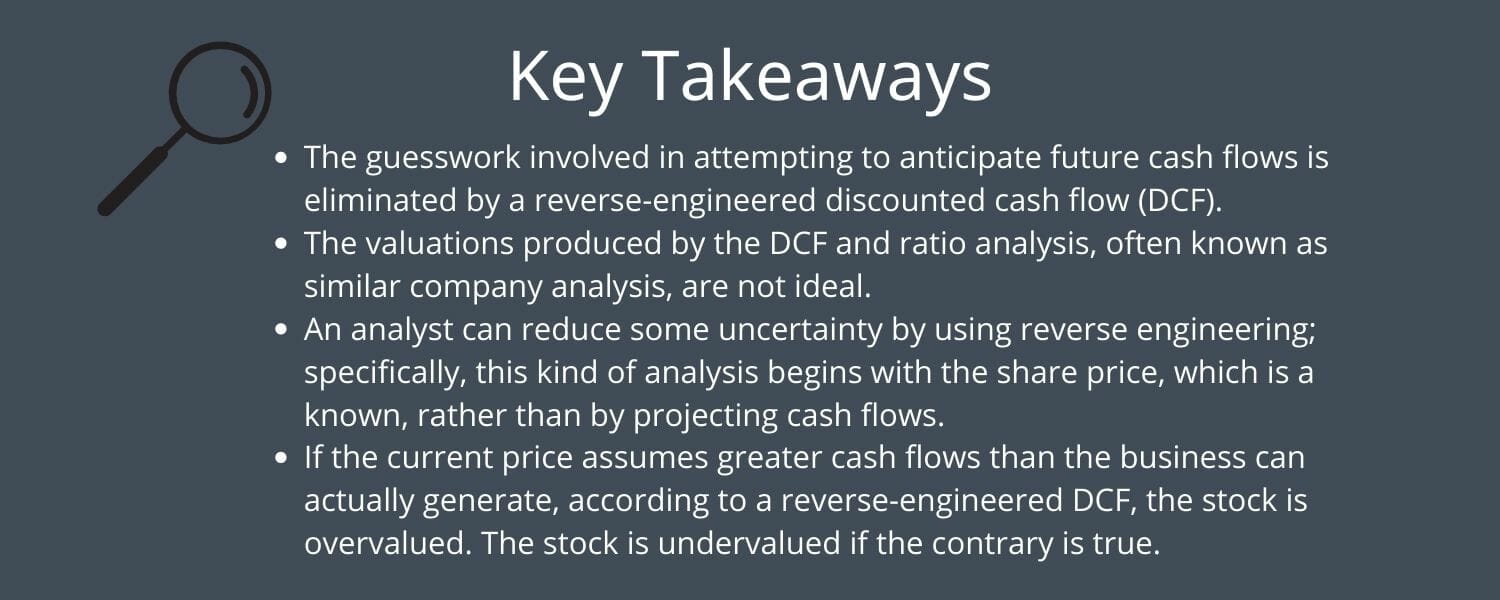
If the reverse-engineered DCF assumes more cash flows than the company can reasonably produce, then the company remains overvalued. If the opposite is true, then the company is undervalued.
Now that we understand what a reverse DCF is and the theory behind the process, let’s explore the DCF a little.
Problems with a Discounted Cash Flow
We have two types of valuation methods out there. The first is “relative valuation,” which uses financial ratios to indicate whether a company is expensive or cheap. By using ratios such as price to earnings, price to book, and price to sales, for example, investors can quickly determine whether a company is over or undervalued.

Relative valuation offers value when comparing peers to each other. Still, it remains rather imprecise as a tool for valuation because it leaves out many variables that help determine a business’s true worth.
The other type of valuation uses models such as the discounted cash flow, which determines a much more “precise” value of the company by setting an absolute price by estimating future cash flows of a business over a 5-10 year period and then determining how much we as investors should pay for those cash flows based on a discount rate back to the present value. Once we value those cash flows, we should know whether the company stays overvalued based on the current market price.
But, there are a few problems with a discounted cash flow, mainly because we are terrible at predicting the future.
- Projecting future cash flows – As mentioned above, all evidence points to the fact that humans can’t predict the future, and predicting future cash flows is no different. There are too many variables in predicting future cash flows based on historical numbers or projections. Even a small error can lead to large changes in DCF valuations when making such forecasts.
- Attempting to calculate an accurate discount rate – Determining the correct discount rate requires a deep understanding of how these rates work, which can lead to errors in valuation. Another potential problem is the tendency to adjust the discount rate to match the intrinsic value that you are seeking.
- Predicting growth rates for cash flows – The biggest issue with determining a reasonable growth rate is that any DCF model will project the growth rate to infinity. Unless we use a multi-stage DCF, our project’s growth rate will go forward for at least ten years.
- Determining a reasonable terminal value – Unless you determine a stopping place, your valuation will go on forever with that current growth rate, and no company, even Amazon, will grow forever. Eventually, all companies return to the growth rate of the economy they are in; the alternative would be that Amazon would be worth the entire economy of the US, then the world.
A better alternative to some of these uncertainties of the DCF is to reverse engineer the model; start with knowns such as the price, and work backward from there.
Using real examples, let’s move on to valuing a stock with a reverse DCF.
How to Value a Stock With a Reverse DCF Using Examples
The first step is determining what discount rates we will assign to our formula and what terminal rate we will have going forward.
Let’s tackle the terminal rate; what I have found that works best is to take the GDP of the country you are investing in and use that terminal rate to project the cash flows into the future. With all the uncertainty surrounding the world, there would be nothing wrong with assigning the long-term rate of the 30-year bond, which is currently 3.53%. Comparatively, the GDP rate currently is 1.7%, according to most forecasts as the US GDP recovers from Covid but struggles with the onset of inflation.
Using our models, as we will see, you can play with the terminal rate to see how it affects your number; my preference, for consistency’s sake, is to use the 30-year bond rate for my models.
Next, let’s tackle the discount rates we will use. There are two lines of thought to tackle the discount rates.
- Use the cost of equity with three inputs. The risk-free rate is the t-bill rate you would assign to your investment for the rate minimum risk you would accept for this investment. Then you would add the risk premium for the country you currently invest in. And finally, include the beta to round out the formula. For example, the risk-free rate for a 10-year bond plus the US country risk premium, which are 3.37% and 5.0, and a beta of 1 gives us a discount rate of 8.37.
- The other school of thought uses the weighted average cost of capital, or WACC. The formula for this discount rate is far more involved than I want to dive into currently, but if you are interested, you can find more information in our other modules.
Each of these discount rates deserves a blog post for themselves, which is for another day, but for our purposes here, I will choose one and go with it. I will use the cost of equity, so our discount rate for any company we choose will get discount rate of 8.37.
It would be best if you were consistent with whichever discount rate you choose; otherwise, you will risk adapting your valuations to fit the price you want.
The first company I would like to use to determine the current growth rate the market prices in for the share price is Walmart (WMT). The current market price for Walmart is $137.02.
Now we will attempt to locate the growth rate we think the market prices into the market value of Walmart, basing that on the terminal growth rate of 3.53% and the discount rate of 8.37% based on the current risk-free rate and county risk premium. Other inputs we need to calculate the reverse DCF:
- Free Cash Flow TTM – $5,419 million
- Cash & Equivalents TTM – $13,293 million
- Long-term Debt + Short-term debt TTM – $53,285 million
- Shares Outstanding – 2761
Now we can determine the growth rate required to achieve the current market price using the data above.
By estimating the growth rate of the free cash flow and plugging the numbers into our model, I get the following ranges:
- 4% growth rate – $94.03
- 6% growth rate – $101.22
- 8% growth rate – $109.21
Based on the rates we plugged in, the market anticipates that Walmart will continue to grow free cash flow at a 14% rate. We can see this is reasonable by looking at the free cash flow growth rate over the last ten years.
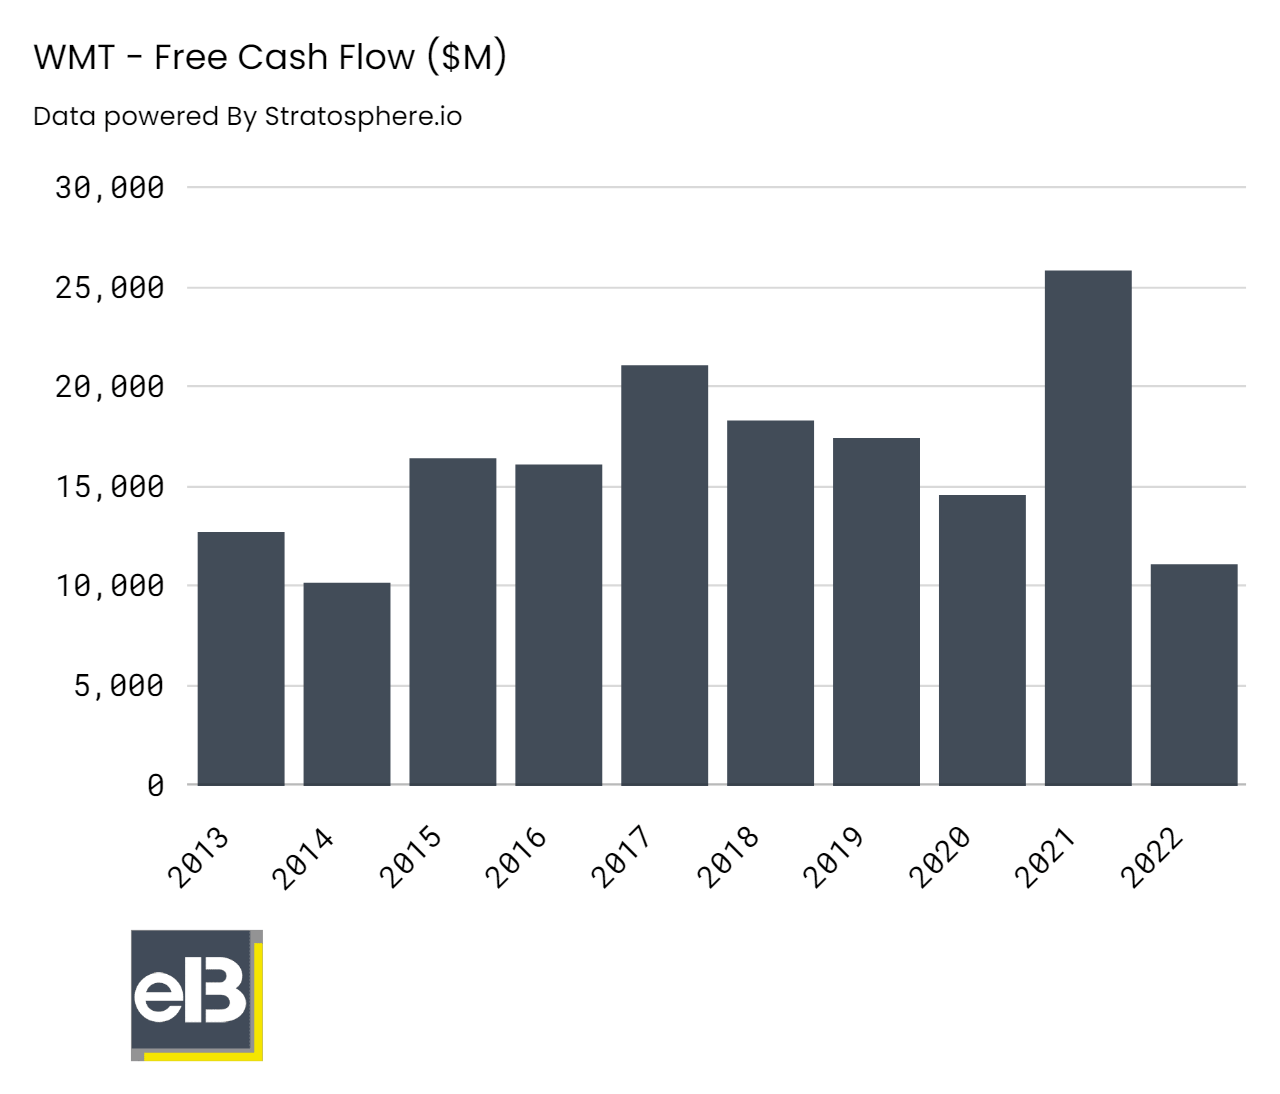
Looking at the annualized growth rate over the last ten years for Walmart, we get a value of (1.31)%. Based on our reverse DCF and the historical growth rates of the free cash flow, it appears the market believes Walmart will grow its cash flows beyond its historical norm.
Wasn’t that pretty simple?
Let’s take a look at it more since this is easy and fun; I know I am a geek!
Look at Apple (AAPL), which trades at a market price of $156.76. Other data we need to calculate our reverse DCF:
- Terminal Rate – 3.37%
- Discount Rate – 8.37%
- Free Cash Flow TTM – $107,582 million
- Cash & Cash Equivalents TTM – $48,231 million
- Long-Term Debt + Short-term Debt TTM – $119,691 million
- Shares Outstanding – 16,330
Now that we have all our data for our discounted cash flow, we can plug those numbers in and find the growth rate the market is pricing into the price of Apple.
- 5% – $133.47
- 6% – $141.56
- 7% – $150.10
Based on the discount rate, terminal rate, and current market price, Wall Street is pricing Apple to grow its free cash flow by 8% yearly. Before freaking out – because that is what I did! – let’s look at the historical growth rate for Apple’s free cash flow.
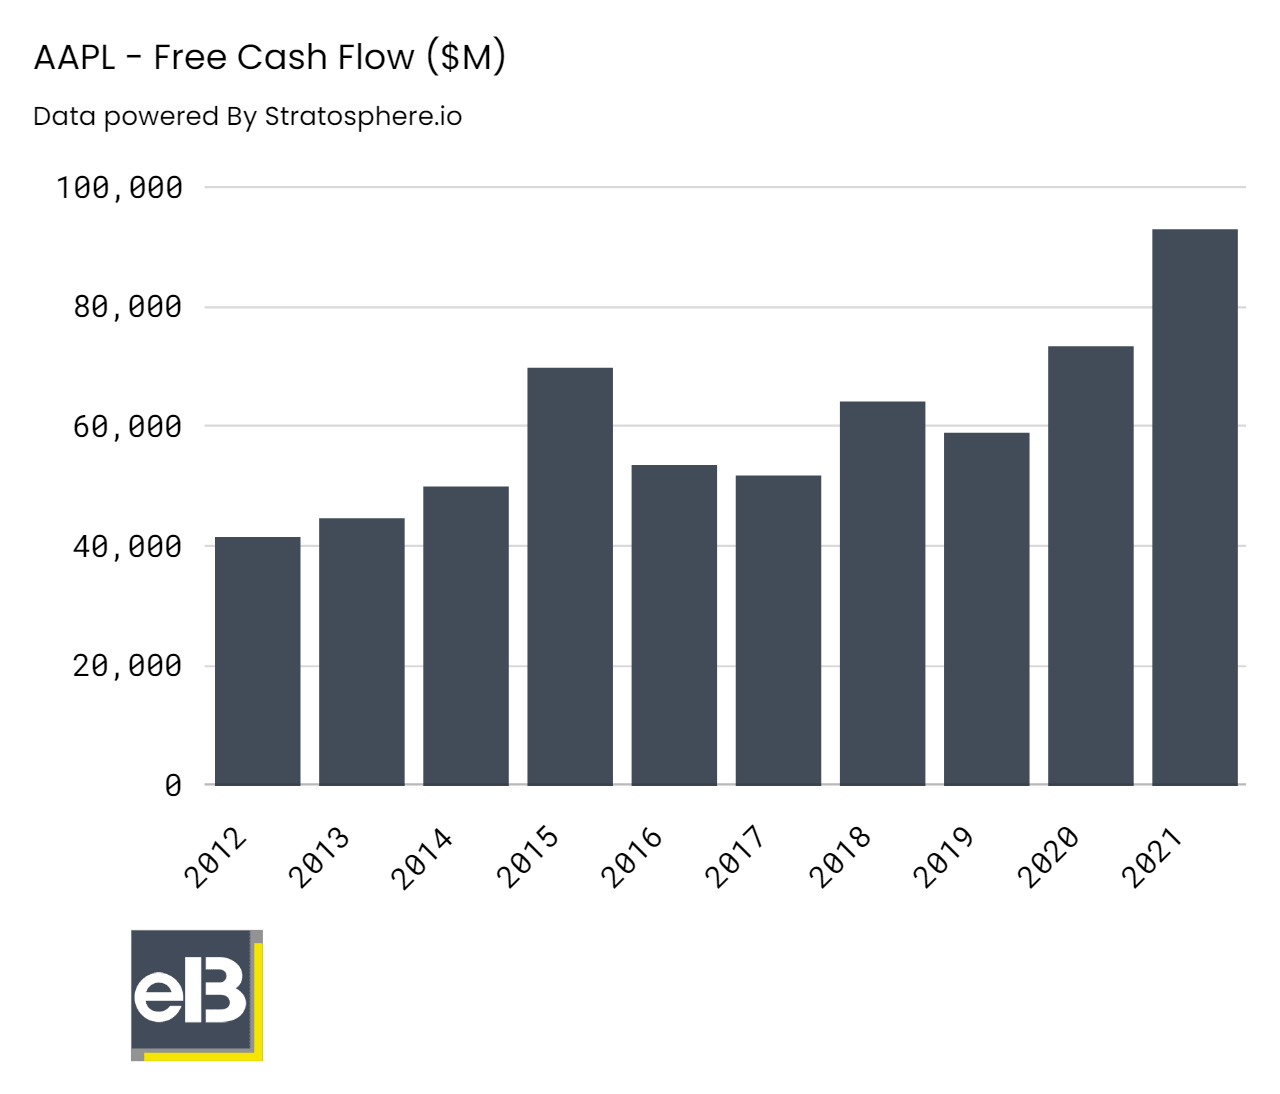
Based on the CAGR of free cash flow over the last ten years of 8.41%, it would appear that Apple is undervalued based on the price of $157. It appears that Apple has room to grow in its annual free cash flow growth rate.
That was interesting.
Let’s take a look at one more just for giggles.
For our last example, I would like to analyze Google (GOOG), trading at a market price of $106. Other data we will need for our reverse DCF:
- Free Cash Flow TTM – $65,185 million
- Cash & Cash Equivalents TTM – $133,970 million
- Long-term Debt + Short-term Debt TTM – $28,602 million
- Shares Outstanding TTM – 13,044
After plugging in our data to the DCF model, we get a range of:
- 5% – $104.52
- 6% – $109.00
- 7% – $113.59
We see a disconnect when we compare the market’s expectations of around 5.5% for free cash flow to Google’s historical performance of 18.4% CAGR over the last ten years. If we look at analysts’ projections for the next five years, they predict Google will grow free cash flow by 16% compounded.
What does all this tell us? It could mean the market undervalues Google’s future performance, and the company has a long runway to grow. Or it could mean the market remains far more pessimistic about Google’s future success, and the company could experience some reversion to the mean.
It’s all part of the fun of analyzing stocks, trying to determine why the market believes what it believes.
Expectations and the divide between those expectations help drive long-term returns for investors.
Investor Takeaway
I use the discounted cash flow model to calculate my returns and what I think is a fair value for a company, but using the reverse DCF makes sense to me to determine a good growth rate for our company. I tend to focus on free cash flow as opposed to earnings when calculating my intrinsic value, as I feel there is less opportunity for fraud in those numbers.
You can use free cash flow, net income or earnings, owners’ earnings, EBITDA, or EBIT as your cash flows. But the bottom line is you must be consistent across your valuations; if you start mixing and matching according to your desire to find a number matching your price, you can run into serious problems.
Remember, no formula or model eliminates working through your checklist to ensure you buy a great company at a fair price. You can’t cut corners; you must do the work. But the more you work through, the better you will get.
That will wrap up our discussion today; I will include a simple DCF model I have created for your use if you don’t already have your own. It’s not pretty, but it will get the job done for you, or by all means, feel free to use your own.
As always, thank you for taking the time to read this post, and I hope you found something of value that can help you with your investing journey.
If I can be of any further assistance, please don’t hesitate to reach out.
Until next time, take care, and stay safe out there,
Dave
When you’re ready, there are 2 ways we can help you:
Little Package of Valuation: Learn how to value companies using various methods, from discounted cash flow models, multiples, and much more. We have put in the reps to help you simplify a complicated process. The models included are customizable to allow you to adapt to your needs.

Value Spotlight: Stock market investors can save time and find success by discovering the right tools and resources. If you don’t know where to start, or are simply tired of wading through the endless sea of financial information, Value Spotlight was created for you.

Dave Ahern
Dave, a self-taught investor, empowers investors to start investing by demystifying the stock market.
