How can you tell when interest rates might rise and what the impact would be on our lives? You can use simple tools to answer questions and be ahead of the curve.
Interest rates have an incredible impact on our lives, from our mortgages or student loans, investments, or what we pay for different goods and services.
Low-interest rates lead to lower prices, and conversely, higher interest rates lead to price increases.
A few simple indicators lead us in the direction of likely interest rate increases. No strong indicator says, “This is it; interest rates will rise.” Rather, it is a combination of indicators giving us clues.
In today’s post, we will cover the following:
- The Three Forces That Shape Interest Rates
- Yield Curve and Its Impact on Interest Rates
- Consumer Price Index As An Interest Rate Predictor
- Producer Price Index As An Indicator of Rising Interest Rates
- Example of Interest Rate Increases
The Three Forces That Shape Interest Rates
Three forces affect the interest rates we are charged here in the U.S. In this section, we will discuss those forces and how they impact interest rates.
I want to stress that the fed determines interest rates, and no accurate indicator will tell you conclusively that interest rates will rise or fall.
Let’s discuss these factors.
Fed Reserve
The main force that the Fed uses to set interest rates remains the fed funds rate. These rates are short-term rates and also variable.
The fed funds rate is the rate banks charge each other to lend Fed Reserve funds overnight.
The fed funds rate is also the rate that is the benchmark for credit cards, bank loans, and mortgages.
Also, the fed funds rate remains one of the main weapons against inflation the fed wields; the rate also acts as a tool to control the economy.
For more on the Federal Reserve and the fed funds rate, check out this blog post that I had previously written.
The Fed uses the fed funds rate to impact the interest rates in the short term. To get an idea of the effectiveness of that impact, they use two benchmarks to compare: LIBOR and Prime.
LIBOR
LIBOR is the rate banks charge each other overnight to meet their federal reserve requirements. All banks must keep a reserve on hand in case of a calamity; it helps ensure they remain solvent in the case of a catastrophe.
LIBOR is an acronym for the London InterBank Offering Rate, which is typically set a few basis points higher than the fed funds rate.
The LIBOR compares overnight bank rates in the global economy, which the Fed compares to its fed funds rate. Typically, the fed fund rates remain lower because it is the first-rate set, whereas the LIBOR acts as a benchmark rate determined by supply and demand on the funds market. The LIBOR calculates from five currencies and different periods from one day to one year.
The fed funds rate operates as a target, and the fed establishes a discount rate based on the target, which remains higher than the target, encouraging banks to borrow from each other rather than pay the higher discount rate.
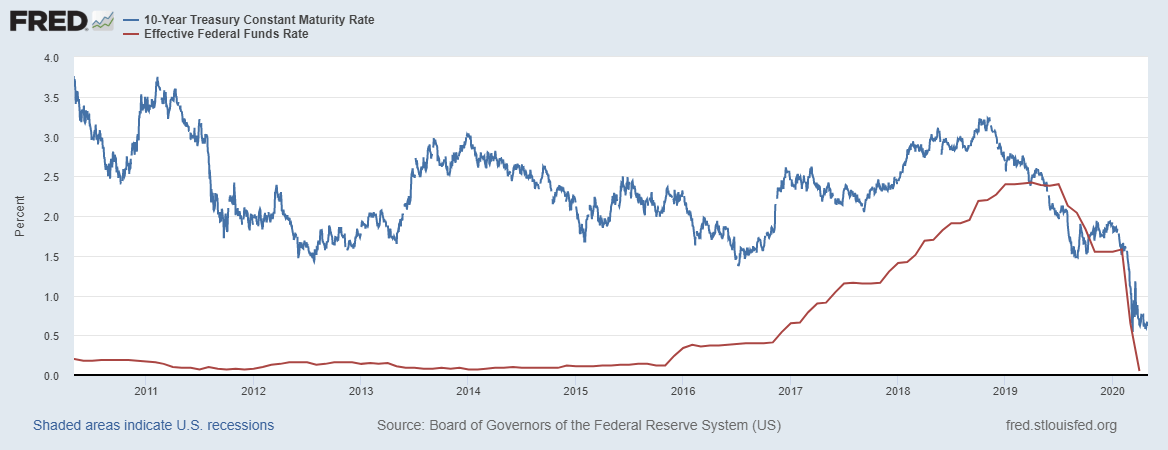
The Fed uses the overnight rates to watch interest rates; usually, the LIBOR follows the fed funds rate rather closely, but there was a divergence during the Great Recession.
The LIBOR offers multiple different rates; for example, the current rates as of May 4, 2020, are:
One month LIBOR Rate – 4.22
Three-month LIBOR Rate – 4.73
Six-month LIBOR Rate – 5.2
And the current fed funds rate is 3.83 for December 14, 2022.
Prime
The prime rate is what banks charge their best customers, usually above the fed funds rate. But it will be a few points below the variable interest rate.
When the Fed changes the fed funds rate, the changes to interest rates can happen quite slowly. In many cases, it can take from three to 24 months for changes to occur. It just takes time for the changes to trickle down through the economy.
Banks base the prime rate on the fed funds rate, generally setting it three percentage points higher. The current prime rate is 7.5%, based on the fed funds rate of 3.83%.
Recently, the banks lowered their prime rate to match the lower level of the fed funds rate, which the Fed lowered on March 15, 2020, from 1.25% to the current level.
Banks base most of their interest rates on the prime rate, so your interest payments might also drop when the prime decreases. The prime rate includes adjustable-rate loans, interest-only mortgages, and credit cards. The rates are often over prime because banks have to cover their losses when loans default. Generally, the higher above the prime, the riskier the investment is perceived.
The prime rate also affects liquidity in financial markets because it encourages more borrowing to expand or reinvest in the company when lending remains cheaper.
The prime rate, LIBOR, and fed funds rate tend to move in tandem with each other. When they don’t, that indicates something is off with the economy and financial markets.
If you see any of these rates increase, that will indicate a rise in interest rates.
Demand for U.S. Treasury Notes and Bonds
We are moving on from the short-term rate set by the Fed and then impacted further by either the LIBOR or the prime rate.
Next, we will discuss the long-term rates that Treasury investors impact.

Interest rates, such as mortgages, remain fixed for the long term, typically for 15 or 30 years. The same remains true for non-revolving credit such as auto loans, education, and large consumer purchases like furniture. These loans are typically higher than the prime rate but lower than revolving credit such as credit cards.
Because these loans typically have one-year, three-year, five-year, and ten-year terms, they vary along the lines of the one-year, five-year, and 10-year Treasury notes. Unlike the prime rate, these rates don’t follow the fed funds rate. Instead, they follow the yields of 10-year and 30-year Treasury notes.
The Treasury Department auctions these notes on the open market to the highest bidder. Bond yields respond to market demand, and yields might be lower if there are great demands for these notes. If the demand is lower, the yields will need to be greater to encourage investment.
How the Banking Industry Affects Interest Rates
Variable interest rates changed along the lines of the fed funds rate until the housing boom of the early 2000s. As the boom accelerated, banks created new variable interest rate home loans. Some banks varied the rates according to a schedule. During the first year, the bank might charge 1%, and the next year or two would see an increase in the rate.
Most home buyers planned to sell before the interest rates increased but struggled when the housing market started to tank in 2006.
Worse still, we have the interest-only loan in which borrowers only pay the interest payments, with nothing included towards the principal balance. And the worst remains the negative amortization loan in which the monthly loan payment remained less than needed to pay the interest.
Instead, the loan’s principal increased each month, which meant that eventually, the loan exceeded the home’s value.
Credit card rates remain the highest because they require a lot of maintenance since they are revolving credit. These rates will remain higher than the prime and typically occupy the highest rates a consumer will pay.
All three of the above reasons remain how interest rates affect our economy as well as give indications of the strength of the economy. Interest rates are important because they control the flow of money in the economy.
High-interest rates help curb inflation but also slow the economy, whereas low-interest rates encourage growth in inflation and help stimulate the economy.
Okay, now that we discussed the three ways the Fed influences the interest rates, let’s discuss how we can determine if rates will rise.
Yield Curve and Its Impact on Interest Rates
The first indicator that interest rates might rise is the yield curve. We discussed this briefly above, but now we will dive deeper.
The short-term interest rate that the Fed sets with the use of the fed funds rate remains arguably the most important in our economy. Interest rates dramatically affect inflation, bond prices, economic growth, equity valuation, housing markets, and even gold.

The interest rate yield curve is the most important for the economy. The yield curve equals the difference between short-term and long-term interest rates. In the U.S., we most often quote it as the difference between the 10-year Treasury rates and the two-year Treasury rates. Additionally, the yield curve remains one of the more reliable indicators of a coming recession.
Interest rates and bond yields are highly correlated, which is why they use the rates in predicting interest rate increases. Bonds come with different degrees of maturity, varying from one month to 30 years.
When speaking of interest rates or yields, it is important to remember that there are short-term and long-term rates. All interest rates remain correlated; they don’t always move in tandem.
For example, short-term rates might decline, while long-term rates might rise, or vice-versa. Understanding the relationship can help you predict interest rate increases plus anticipate possible recessions.
There are three types of yield curves. They are normal, inverted, and flat.
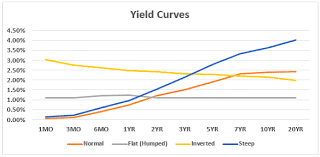
Normal Yield Curve – A normal yield curve starts with low yields for lower-maturity bonds and then increases for bonds with higher maturity. Think of the classic chart of moving from lower to the left and climbing higher as it moves to the right.
As the curve ascends to the right, eventually, it evens out as maturities plateau and flatten out the curve. The normal curve is the most common type of yield curve. Longer-maturity bonds have higher yields than shorter-maturity bonds. Such a curve indicates a stable economy and a normal economic cycle.
Flat-Yield Curve – A flat yield curve indicates similar yields across all maturities. You may have bumps along the road, but as shown in the above chart, the yields and maturities are similar.
A flat curve indicates economic uncertainty. It could occur after a period of high growth, which might lead to high inflation and fears of an economic slowdown. Or it might indicate that there are fears the Fed will raise rates.
The uncertainty leads to investor indifference to the maturities of bonds as yields flatten out across maturities.
Inverted Yield Curve – As you can see from the above yellow line, the inverted curve is opposite to the normal curve and is sloping downward. An inverted curve is where short-term interest rates exceed long-term rates, or short-term maturities have yields exceeding long-term maturities.
An inverted yield curve is abnormal but is a fantastic indicator of an economic slowdown or recession.
An example of bond yields assumes a 2-year bond yield of 4.5%, a five-year bond yield of 3.88%, a 10-year bond yield of 4.13%, and a 30-year bond yield of 4%.
While we can’t use the yield curve to predict exact interest rate numbers and yields, closely tracking its changes allows us, investors, to possibly anticipate and benefit from either short- to mid-term changes in the economy.
Normal curves exist for longer durations, while an inverted yield curve is rare and may not show up for decades, although we have seen two in the 2000s. Yield curves that change to flat and steep shapes help predict changes in the interest rate environment.
Okay, let’s move on to the next predictor of interest rate increases.
Consumer Price Index As An Interest Rate Predictor
The consumer price index measures monthly U.S. prices for goods and services. It helps track inflation or rising prices and deflation or declining prices.

The Bureau of Labor Statistics creates the index and surveys 80,000 consumer items to create it. They represent over 87% of the population and the prices of a cross-section of goods and services the general public buys. They gathered information from 23,000 retail and service companies.
One item to keep in mind: it does not represent the sales prices of homes, but it does include sales taxes.
The most important reason to follow the CPI is that it measures inflation. As the Fed has one of its main mandates to control inflation, this metric is a great one to watch carefully. If the Fed sees inflation increasing, it may raise interest rates to slow the economy.
Okay, now on to the next indicator of an increase in interest rates.
Producer Price Index As An Indicator of Rising Interest Rates
The producer price index (PPI) is published through the Bureau of Labor Statistics, the same body that produces the consumer price index. The producer price index is a group of indices that represents the average movement of selling prices in domestic production over time.
The main difference from the consumer price index is the producer price index measures economic activity from the standpoint of the producer, not the consumer.
Not as commonly referred to, the PPI is also a fantastic predictor of inflation or interest rate changes. The importance of this metric is that it can serve as a leading indicator of the consumer price index. When producers face rising inflation, those costs are passed along to consumers, leading to inflation of their prices.
That alone makes following the producer price index a great indicator of inflation, which we now know leads to an increase in interest rates to cool the economy.
Now that we have some idea of what to look for, let’s look at an example of conditions that lead to an increase in interest rates.
Example of Interest Rate Increases
After the latest Great Recession from 2007 to 2009, there was a long period where the Fed kept the rates artificially low to help stimulate the recovery from that terrible period.
The Fed, under Janet Yellen, began raising the fed funds rate from 0% to 0.5%.
At that time, inflation was 0.7%, and unemployment was 5.0%. Other indicators at the time:
- CPI – 7.8%
- PPI – 10.5%
- 2-year Treasury Notes – 0.85%
- 10-year Treasury Notes – 2.14%
Compared to 2007, when the recession began:
- CPI 4.1%
- PPI 3.2%
- 2-year Treasury Notes 4.93%
- 10-year Treasury Notes 4.11%
- Inflation 4.1%
- Unemployment 5%
We can see the inverting of the yield curve from the numbers in 2007, which would have indicated that interest rates were going to fall, which they indeed did in reaction to the meltdown in the economy then.
Compared to 2022, you can see a normal, rising yield curve, indicating that interest rates might increase because you can see how much higher the other indicators are, including abnormally low inflation.
Final Thoughts
Interest rates are some of the most significant rates in our economy. Rising rates have an incredible impact not only on our investment decisions, but also our purchasing decisions and how much we might pay for any loans or credit products we own.
We can follow multiple indicators to get an idea of possible interest rate increases—namely, the yield curve, consumer price index, and producer price index.
The other indicator remains the Federal Reserve Board’s periodic meetings, which meets eight times a year. Many follow these meetings very closely, and each word is analyzed to decipher the intent regarding interest rates.
We have access to the transcripts of those meeting notes through the Fed website, but I prefer to read through the reports from other investors I respect. Much of the language remains legalese, and they provide clarification of the gobbly goop of fed speak.
We have no way with any certainty to predict when interest rates are going to rise, but in the current world we occupy, they can rise or fall depending on the economic situation. But using the indicators we discussed, you can understand when you think those changes might occur. And as a bond investor, you can make changes accordingly.
That will wrap up our discussion for today; I want to thank you for taking the time to read this post.
As always, I hope you find something of value and that it can help you with your investing journey.
If you have any questions, don’t hesitate to reach out.
Until next time.
Take care and be safe out there,
Dave
