Corporate officers are in the business of allocating capital. The goal for each CEO is to return an attractive return on its capital. All companies create value for their company and shareholders when they earn a return above the opportunity for other capital allocations. One way to measure those returns is the metric, ROIC, and an ROIC tree helps you understand the inputs for that ratio.
Many great CEOs are great capital allocators, such as Warren Buffett, Jeff Bezos, and Steve Jobs. They created better opportunities for their companies by allocating their capital in amazing ways. Those capital allocations allowed their companies to grow tremendously, creating life-changing products and systems.
Understanding the different drivers of value and how they impact the company’s capital allocations helps investors see what drives its growth.
In today’s post, we will learn:
- Return on Invested Capital Refresher
- Building an ROIC Tree
- Finding the Value Drivers with an ROIC Tree
Okay, let’s dive in and learn more about the ROIC tree.
Return on Capital Refresher
Return on invested capital, return on capital, or return on investment are all interchangeable terms that focus on the same idea—measuring the returns on capital that a company can generate from their capital.
The company’s capital stems from its assets, liabilities, and equity, which helps it grow its revenues. Those revenues or sales flow create more assets, cash flows, and profits that the company can reinvest for more growth. Think of it as a circle of life for a business.
Each company has a choice when deciding how to allocate its capital. They can:
- Pay a dividend
- Buyback shares
- Pay down debt
- Reinvest in the business
- Make an acquisition
All of the above choices impact the performance of the business and shareholders. For example, if the company chooses to reinvest in its business or makes poor growth choices, that destroys value and detracts from better returns elsewhere; for example, paying the investor a dividend or buying back shares would be a better choice.
The basic idea behind the ROIC metric is the net operating profits after taxes compared against the company’s invested capital.
The simple formula is:
ROIC = NOPAT / Invested Capital
NOPAT equals the operating profit of a business after deducting the costs or revenues or costs of goods, SG&A (service, general & administrative), depreciation and amortization, and income taxes.
The theory is that NOPAT equals the cash flows of the business’s operations, and value derives from the cash flows, not earnings.
Invested capital contains all the necessary ingredients from the assets and liabilities to grow the business’s revenues. Line items such as accounts receivable, inventories, accounts payable, and others help the company operate. Inventories, for example, help provide the raw materials to produce its products.
The value of the company, represented by the ROIC metric expressed as a percentage, tells us how efficiently the company reinvests its capital. If Microsoft has an ROIC of 26%, that tells us that the company produces $0.26 for each dollar of capital. And the higher, the better.
To better understand ROIC, it must be compared to a company’s cost of capital or WACC. The larger the gap between the two metrics, the more value is created. The WACC tells us how much capital costs the company, and the returns higher than that cost drive growth higher.
For example, if Microsoft carries an ROIC of 28% and a WACC of 6.2%, that tells us that Microsoft can reinvest its capital at a greater rate of return than the cost of that capital. On the reverse of that, if a company carries an ROIC of 5% and its WACC is 6%, then it is destroying wealth by poorly allocating its capital below the cost of the capital.
For a deeper understanding of calculating ROIC and WACC, please refer to the below posts before moving on with today’s post:
Weighted Average Cost of Capital + Calculator
Building an ROIC Tree
The easiest way to think about the ROIC formula is a version of the discounted cash flow model. The reinvestments help grow the value of the company. Let’s look at a simple five-year discounted cash flow model for the components. We will assume the following for our model:
- NOPAT growth = 8%
- ROIC growth = 25%
- WACC = 7%
|
Year 1 |
Year 2 |
Year 3 |
Year 4 |
Year 5 | |
|
NOPAT |
$100 |
$108 |
$116.6 |
$126 |
$136 |
|
Investment |
32 |
34.6 |
37.3 |
40.3 |
43.5 |
|
Free Cash Flow |
$68 |
73.4 |
79.3 |
85.7 |
92.5 |
As we can see from the above, cash flows grow exponentially as the company reinvests at a higher rate over the years, growing revenues exponentially, all of which flow to free cash flow. It is a virtuous circle.
But the question remains: What drives those returns? The reinvestments drive revenue growth and cost decreases through better inventory buying or a quicker cash conversion cycle. These investments drive better operations for the company, creating growing cash flows.
The value Microsoft creates each year comes from the cash flows it generates and the change in its continuing value.
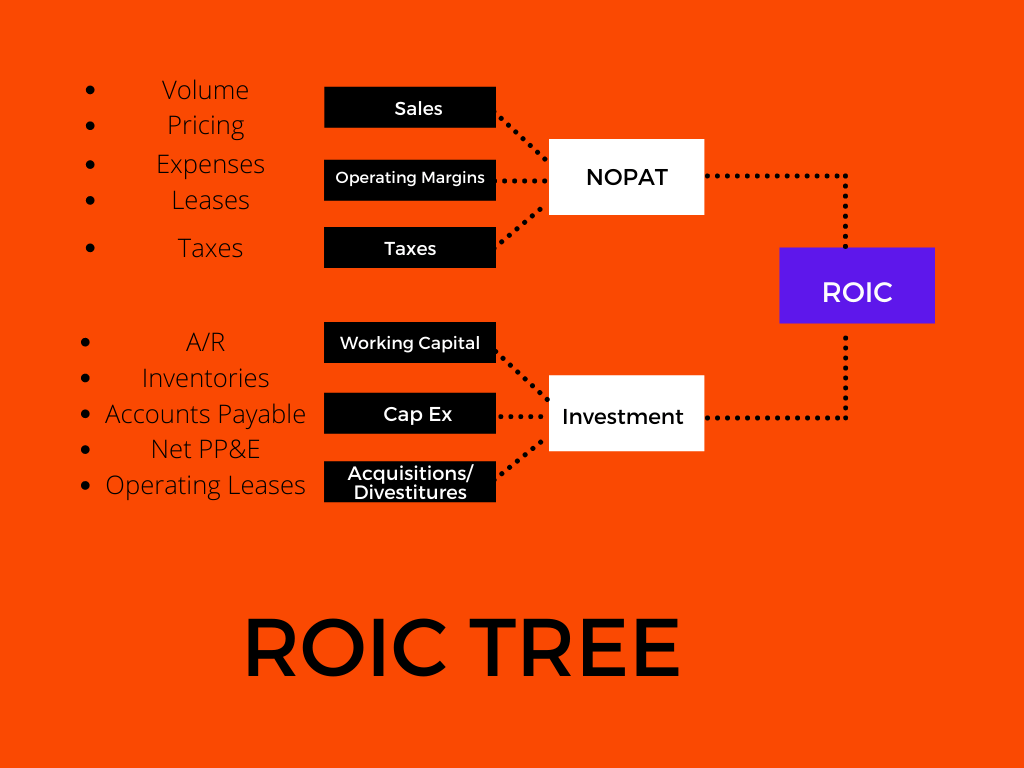
Each section of the ROIC formula stems from a different part of the income statement and balance sheet. NOPAT focuses on the income statement, and Investments focuses on the balance sheet.
Building an ROIC tree helps us understand the inputs for each formula segment. Creating a tree branching away from each line item shows how different items drive the company.
For example, sales flow to the operating margin, which flows to the NOPAT. At the same time, the inventories flow to the working capital that flows to the company’s investments.
Let’s explore this a bit more.
For example, Intel, which creates semiconductor chips among other products, requires inventories to drive sales. Those inventories are on several levels, such as the raw materials to make the fabs for the semiconductor chips and the finished products they hold until they are sold to customers.
Inventory is a “wasting” asset in that it is cash sitting in inventory until it is sold, and the company can collect cash for that sale. Intel pays cash for the raw materials, equipment, and payroll to produce those chips. And until Intel sells those chips, that is cash sitting in the inventory, which does Intel no good until redeemed.
By linking the inventory to the company’s working capital, we see how that investment flows to Intel’s ROIC. The working capital connects to the company’s operations; with those inventories, Intel can produce semiconductor chips to sell and has revenue growth.
Finding the Value Drivers with an ROIC Tree
The ROIC tree helps us connect the company’s financial statements to the company’s value drivers. Topline growth only happens organically, despite some investors thinking revenues grow alone.
Revenues stem from the company’s operations, and the more efficiently a company uses its capital, the more it will grow over time.

To illustrate these ideas, let’s look at the value drivers for Microsoft. To do this, we will compare the company’s current ROIC and WACC:
- TTM = 30.68
- WACC = 6.15
Some other numbers to consider as well, third-quarter 2021 in millions unless otherwise stated:
|
Revenues |
$41,706 |
|
Costs of goods sold |
13,045 |
|
Gross Profit |
28,661 |
|
R&D |
5,204 |
|
Sales and Marketing |
5,082 |
|
General and Admin |
1,327 |
|
Operating Income |
17,048 |
|
Tax rate |
10.43% |
If we look closer at the quarter, the margins for the company were:
- Gross margin = 68.72%
- Operating margin = 40.88%
Now, let’s look at the quarterly report, 10q, which tells us what impacts each line item for Microsoft. Remember that the NOPAT for the quarter is the company’s operating cash flow minus its investments.
According to the company’s 10-q, the company’s costs of revenues grew 19% for the quarter, driven by the increases in costs in the commercial cloud and Gaming divisions, offset by a reduction in depreciation expenses in network equipment.
If I look at the quarterly gross margin for the previous 2nd quarter, we can see an increase of 1.67% and an increase of 0.06% from the year-ago quarter. The company grew revenues by 19% or $6.7 billion in the quarter. Still, the company was able to drive down its gross margins or revenue costs by efficiencies in all of its segments by reducing the depreciation costs of equipment.
The company’s operating margins shrank in the quarter by 0.67% as expenses in R&D, Sales and Marketing, and General and Administrative increased. Because of those increases in expenses, the company’s operating profit shrank by $4.1 billion.
Looking back at our ROIC tree, we can see that volume increases help the company increase its gross profits, but expenses reduce the company’s overall operating profit.
After reading through the 10q, we see the impacts of those operating expenses on the NOPAT as the reduced operating profit flows to the NOPAT. For example, if the company chooses to reduce its R&D spending, those reductions flow to greater profits for Microsoft. But going back to the discussions on capital allocation, we must consider what type of business Microsoft operates, such as technology. And thinking deeper about that, a decision to spend less on R&D for a tech company would spell disaster in the long run.
A Microsoft that doesn’t create or improve its current products and services will not enjoy continuing revenue growth. The same applies to Apple, Google, and Tesla. A company like Walmart won’t have to spend as much on R&D as Microsoft, but those decisions have long-term impacts.
Those are just some of the impacts we can take from looking at the NOPAT side of the equation.
Now, let’s look at the Investment side of the equation.
If we look at the investments a company such as Microsoft makes, we need to take into account the items including:
- Accounts receivable
- Inventories
- Accounts payable
- Goodwill
- Intangibles
And if we look closer at a few of these, we find:
Accounts receivable – this account tracks customers who receive a product but haven’t paid for it. Consider financing the Azure product, for example. Microsoft’s balance on its balance sheet is money owed to it, and when it receives a payment, it reduces the balance.
Inventories – This line item contains raw materials, work in progress, and finished goods for Microsoft. It helps drive the company’s revenues, albeit on a smaller scale. Microsoft grows most revenues from Azure and SaaS businesses such as Office products. It only requires a small amount of inventories to grow revenues.
Considering Microsoft’s business, let’s compare the list above to our ROIC tree. What do you think drives the Investments?
Most of a company’s working capital contains goodwill, intangibles, Net PPE, and accounts receivable minus accounts payable. As we can see, debt has no bearing on the company’s working capital investments, which makes sense for Microsoft.
Another consideration is thinking about items such as R&D. Most companies expense their R&D and SG&A, but one could argue that they are working capital investments for tech companies.
As the nature of businesses has changed, the accounting rules have yet to adapt. Companies such as Saas, Shopify, Netflix, and much more expense any R&D, but they are capital-light companies. Diving deeper into their financials, we see they only require a little conventional working capital to grow revenues; rather, innovations or products developed from R&D guide growth. Think of Apple and the creation of the AirPods, which help Apple grow more revenues.
But getting back to the ROIC tree, think about how accounts receivable help grow Microsoft’s investments. As the company receives payment for its receivables, it reduces Investments but increases revenues, which grows its ROIC.
Investor Takeaway
Understanding ROIC and its components helps us examine its efficiency and how it grows revenues. How a CEO allocates capital can help us determine the quality of management, and a higher ROIC also indicates the possibility of a moat.
An ROIC tree helps us visualize the components of ROIC and their potential impacts on the company’s performance. The tree helps us see how each improvement or decrease in each tree branch flows to each branch. The companies improve operating margins, which grow the NOPAT and the branches connected to the investments.
ROIC versus WACC is an important concept to consider when considering investing in any company. The ROIC can tell us how well management operates the company, allocates capital, and plans for the future. ROIC can indicate a moat because the better a company performs, the better it produces.
A key indicator of a company’s ability to allocate its capital is creating value-based investments. Understanding how ROIC works and using an ROIC tree to assess the value drivers is a great way to find wonderful companies as intangibles rise in value.
“Leaving the question of price aside, the best business to own is one that can employ large amounts of incremental capital over an extended period at very high rates of return.”
– Warren Buffett, 1992 Berkshire Hathaway Shareholder Letter
With that, we will wrap up our discussion on the ROIC tree. As always, thank you for taking the time to read today’s post, and I hope you find something to help you on your investing journey. If I can further assist, please don’t hesitate to reach out.
Until next time, take care and be safe out there,
Dave

Dave Ahern
Dave, a self-taught investor, empowers investors to start investing by demystifying the stock market.
