Updated 8/25/2023
ROIC (Return on Invested Capital) and ROCE (Return on Capital Employed) are formulas describing how efficiently a company invests its capital. The difference between ROIC vs ROCE is subtle but powerful—basically, one (ROCE) is a shortcut of the other (ROIC).
Before diving deeper, here’s the simple cliff notes:
Return on Capital Employed Formula (ROCE)
ROCE = EBIT / (Total Assets – Current Liabilities)
Return on Invested Capital Formula (ROIC)
ROCE adjusted for taxes, debt, capital leases, cash and securities
Now, what’s the basic impact of these differences? We will cover:
- Why ROIC and ROCE Are Important
- ROIC vs ROCE: Cash and securities
- ROIC vs ROCE: Certain Long Term Liabilities
- ROIC vs ROCE: Geographical tax differences
- Summary
Explaining this side of finance can get heavy, so grab a cup of coffee and let’s dive in!
Why ROIC and ROCE Are Important
Investors generally want to see a high ROIC and ROCE because it implies that a company can grow easily.
When a company has a high ROIC/ROCE, this means that it needs less capital to grow its earnings (or ROI, Return on Investment).
If a company can get a 6% ROI (on invested capital), for example, this means that for every $100 invested they will earn $6 in profits. So, in theory, a company with a 6% ROI, ROCE, ROIC (whatever you want to call it) will grow 6% a year if it reinvests all of its profits.
A company reinvesting all of its profits at a 6% ROI/ROCE/ROIC would see its profits go like this:
- Year 1 = $100
- Year 2 = ($100 * 6%) = +$6.00 + $100 = $106
- Year 3 = ($106 * 6%) = +$6.36 + $106 = $112.36
You can see how each new infusion of capital raises the earning power of the company, and builds on top of last year’s earning power.
If you were to measure the difference in earnings from year-to-year, you’d see that 6% growth rate which corresponds with the 6% ROI/ROCE/ROIC. Remember this is a simplistic example, and it depends on a company reinvesting all of its profits moving forward.
This is why high ROCE/ROIC companies tend to carry a higher valuation in the stock market (higher P/E, etc), because their ability to earn high returns on reinvested capital makes it easier for them to achieve high growth rates.
And so, a company with a ROIC of 20% for example, could reinvest half of its earnings to earn a 10% growth rate while giving back the other half of its earnings in dividends.
When you hear of “capital intensive” companies, they usually can be attributed to lower ROCE/ROICs, since more capital is required to sustain growth.
In the real world, the growth and ROCE/ROIC tie is not that simple.
There’s many reasons why, here’s just a few examples:
- ROCE/ROIC is past looking, not forward looking
- ROCE/ROIC can swing wildly, especially in companies with high degrees of operating leverage (DOL)
- Companies can grow for reasons outside of reinvestment (revenue growth, margins expansion, acquisitions). These can prop up ROCE/ROIC
There’s a few other reasons that a company’s ROI formulas, particularly ROCE, can depart from the real relationship between a company’s growth and return on reinvestments.
ROIC tries to capture some of those discrepancies; let’s talk about each of those major components next.
1—ROIC ignores cash; ROCE doesn’t
Generally if a company is more conservative with their cash (or investment securities), they will see lower ROCEs compared to their ROIC.
This is because in the Invested Capital formula for ROIC, cash & equivalents is adjusted out, making a company’s cash (and securities) balance have no impact on the formula.
But in ROCE, the Capital Employed doesn’t ignore cash & equivalents. So, if a company carries excess cash in much greater amounts than is required to run the business, this will reduce the company’s ROCE since the denominator, Capital Employed, is higher due to the excess cash.
Take the example of Cisco.
This is a company that has historically had large cash balances, while also parking a lot of retained earnings into short-term marketable securities (they are like holding cash but with interest).
You can see their historical difference between ROCE and ROIC, as I calculated using historical figures from quickfs.net:
- Cisco, ticker $CSCO
- Return on Capital Employed (ROCE) = 20.5%
- Return on Invested Capital (ROIC) = 54.3%
Doing a sanity check by looking at the company’s balance sheet (using bamsec to lookup the company’s 10-k), we can see that in fact Cisco does have a large amount of cash and securities on the balance sheet:

Since any interest income earned by long term securities held on the balance sheet is ignored by both ROCE and ROIC (their numerators exclude interest from earnings), this effect is somewhat magnified.
The large spread between ROIC and ROCE implies that the core business is highly capital efficient, but actual returns accrued to investors is much lower due to all of the idling cash.
However, like I mentioned earlier, the actual growth possible from reinvestment into high ROIC (in the real world) often has many other factors, which can cause management to decide not to reinvest more capital at the time. Most of the time you should be able to trust this intuition, when it comes from good management teams.
The actual returns earned by investors of Cisco is much closer to its ROCE instead of its ROIC, which you can argue is a better measure of a future growth rate than a strict ROIC/retention ratio would be.
Note that you can reduce some of the wilder swings in ROCE/ROIC due to excess cash by adjusting “cash & equivalents” to be “excess cash above cash needed to operate the business”. If a particular business needs lots of cash for working capital in its day-to-day operations, this might put their cash balances higher than other companies long term. In that case, you’d want to average out the company’s normal cash balance and adjust Invested Capital for the excess cash only, rather than all cash & equivalents.
2—ROIC can be manipulated through special large liabilities
A second discrepancy between ROCE and ROIC is the treatment of certain long term liabilities.
If you think about how ROE (Return on Equity) can be manipulated—by adding liabilities such as debt, and repurchasing shares (or paying a dividend) with the proceeds, to reduce shareholder’s equity—then it similarly shows that ROIC can get a boost if it accumulates certain long term liabilities.
This is because part of the formula for Invested Capital is equity (shareholder’s equity).
Since Shareholder’s Equity equals Total Assets minus Total Liabilities, any increases to Total Liabilities can decrease Invested Capital, which boosts ROIC.
ROIC ignores debt by adding it back to equity, which keeps a company from adding debt to boost ROIC, but other increases in long term liabilities are not added back and could similarly boost ROIC.
Examples of these long term liabilities which could depress Invested Capital:
- Pension liabilities
- Deferred revenue (long term)
- Deferred tax liabilities
To see what I mean about these, consider the difference in ROCE and ROIC for $UPS.
- $UPS
- Return on Capital Employed (ROCE) = 18.3%
- Return on Invested Capital (ROIC) = 27.6%
If we were to take a closer look at UPS’s balance sheet, we would see a large portion of pension liabilities:
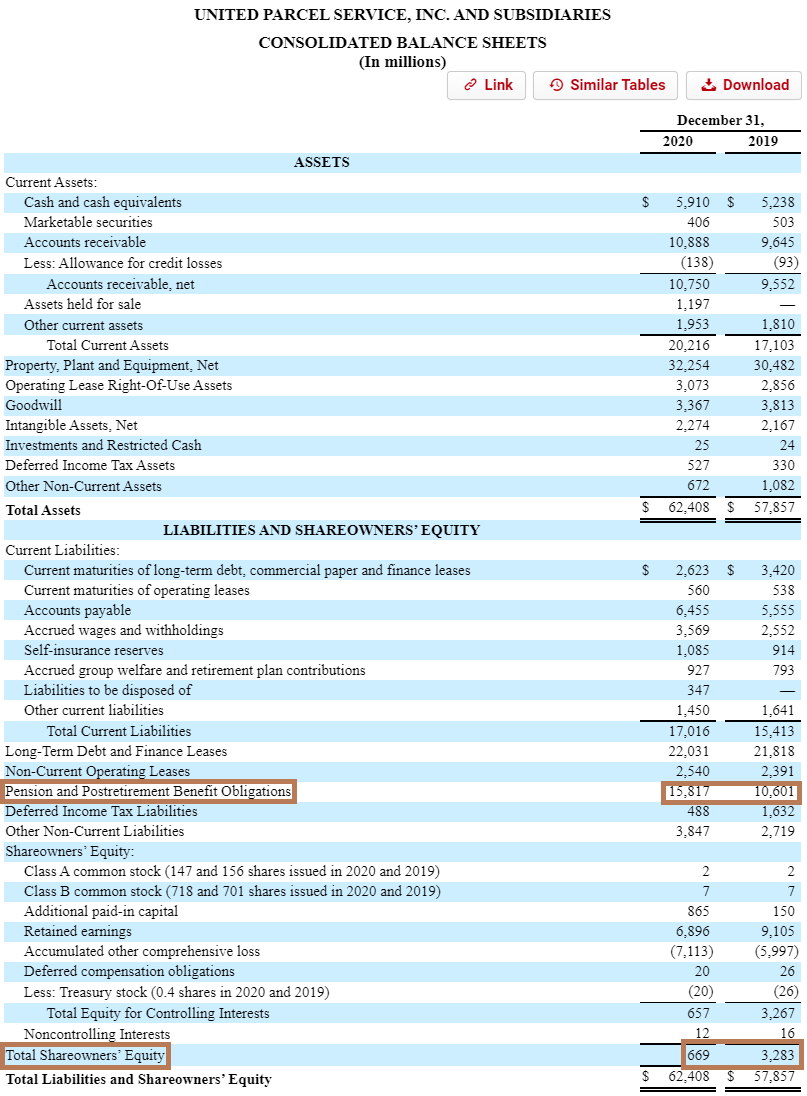
These are especially big compared to total liabilities and shareholder’s equity.
Since ROCE doesn’t include long term liabilities such as pension liabilities in its capital employed formula, the large amount of pension liabilities on UPS’s balance sheet doesn’t boost its ROCE.
You can see how it does boost UPS’s ROIC, even though these pension liabilities may not really have had any impact whatsoever to the capital reinvested by the company lately.
In the case of UPS, you could argue that pension liabilities ARE required to run and grow its current business as they are part of the company’s ongoing hiring strategy. To ignore these real liabilities and exclude them from a formula like ROIC understates the true cost of growth for the company through hiring.
This is one example where ROCE might be a better use than ROIC for evaluating UPS’s future growth potential.
Note that you can bypass this problem for ROIC if you calculate Invested Capital from the asset side of the balance sheet rather than the Liability/Equity side. That formula looks like the following Invested Capital = Non-cash & non-debt working capital + Net PPE + Operating ROU assets + Goodwill + Intangibles & Other assets. Most websites online will tell you to calculate Invested Capital the other way, but hopefully these large, special long term liabilities show you why that might be a bad move.
3—ROCE ignores favorable tax treatment from geographical revenue mix
It’s common for companies which earn revenues abroad to pay less taxes on their income than companies who do business solely in the U.S.
This is because, (A) state income tax gets charged on top of federal tax, and (B), certain countries have much lower tax rates than the U.S. does.
You can see an example of this if you looked at a company like $TMO, again using historical figures from quickfs:
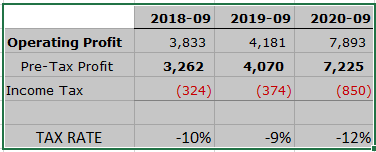
Based on the company’s pre-tax income and tax paid over the last 3 years, the company’s effective tax rate was around 10%. Compare that to someone with all of their revenues earned in the U.S., and their effective tax rate over the last 3 years is usually around 21-25%.
The tax benefit based on a company’s geographical revenues mix is a real increase in cash flows and returns to investors, but is not represented in ROCE.
This is because ROCE takes EBIT (Earnings Before Interest and Taxes) for the numerator, which does not take interest expense or tax considerations into the company’s overall returns.
On the flip side, ROIC’s numerator uses NOPAT, which is an after-tax calculation.
To calculate NOPAT, you must estimate the company’s effective tax rate, which does boost the profitability of Return on Invested Capital if the company has significant revenues in favorable tax places.
For an illustration of just how much the difference in tax rates can impact a company’s ROIC vs ROCE, look at $TMO again:
- Thermo Fisher Scientific, ticker $TMO
- Return on Capital Employed (ROCE) = 20.5%
- Return on Invested Capital (ROIC) = 54.3%
Summary of ROCE and ROIC
As promised, here’s the full formulas for each metric:
ROCE
= Return on Capital Employed
= EBIT / Capital Employed
= EBIT / (Total Assets – Current Liabilities)
ROIC
= NOPAT / Invested Capital
= [Operating Income * (1 – Tax Rate)] / Invested Capital
Where Invested Capital can be calculated in two (or more) ways:
Invested Capital (A)
= Debt + (Shareholder’s) Equity + Capital Leases – Cash – Securities
Invested Capital (B)
= Current Assets – Cash – Current Liabilities + Short Term Debt + Net PPE + Operating ROU Assets + Goodwill + Intangibles + Other Long Term Assets
You can see that the Invested Capital (A) formula is much simpler and gets down to the essence of what ROIC tries to do, which is give you the potential growth from reinvested capital ignoring debt, leases, and cash and securities. This tries to get to the operating results and growth of the core business based on reinvested capital.
But, using this shortcut for ROIC does have its potential weaknesses, as we saw with certain long term liabilities such as pension liabilities.
ROCE also has its own weaknesses as we discovered, primarily with the differences in taxes.
No one tool, whether you’re talking about ROIC, ROCE, or ROE, is the magical solution for evaluating great businesses; each should be used for different applications with its pluses and minuses in mind.

Andrew Sather
Andrew has always believed that average investors have so much potential to build wealth, through the power of patience, a long-term mindset, and compound interest.
