Updated 2/7/2024
Short-term debt and current liabilities are often combined into the same bucket. When calculating a company’s debt-to-equity ratio, most investors use the total liabilities divided by the equity.
Analyzing a company’s debt position can be useful to determine whether the company uses debt to fuel its growth, which, in some cases, remains beneficial for the company.
Where danger can lurk in a company taking on more debt than it can handle, we need to measure its ability to cover its interest payments. Understanding when the payments come due can significantly impact the business’s cash flow.
Investing in companies that take on too much debt can lead to disaster. Hence, using ratios and reading the balance sheets of every company you buy remains crucial to avoid losing money. Remember Buffett’s rule number one: don’t lose money.
We have many ways to determine the viability of the company’s debt load and how to use our Sherlock Holmes to investigate the debt. Remember, not all debt is bad; it is just more than the company can handle.
Items we will discuss today:
What is Short-term debt?
According to Investopedia:
“Short-term debt, also called current liabilities, is a firm’s financial obligations expected to be paid off within a year. It is listed under the current liabilities portion of the total liabilities section of a company’s balance sheet.”
Companies accumulate two kinds of debt: financing and operations. Debt from financings stems from raising capital to grow the business, whereas debt from operations stems from the running of the business and naturally occurs.

Financial debt is typically long-term, meaning the obligations extend for over twelve months. The line item is listed after the current liabilities under the total liability section of the balance sheet.
Operating debt comes from the necessary actions required to run the business. For example, items such as accounts payable are expected to be resolved within one year.
Operating debt is short-term debt and comprises short-term bank loans or commercial paper.
The line item concerning the short-term debt equals the subject of a quick bit of focus when determining the performance of our company. The debt-to-equity ratio helps us determine the amount of debt a company has about its capital. And a higher ratio remains of concern regarding the company’s liquidity.
If the current liabilities are higher than the cash and cash equivalents, the company might be in poor financial health and be in danger of being unable to meet its obligations and pay off all of its debts.
Current Liabilities
We have defined short-term debt; let’s examine the current liabilities further and break down each line item on the balance sheet.
Short-term bank loans
The most common type of current liability is a short-term loan. These loans originate from the need for companies to raise funds to operate the business and fund working capital needs. They are also known as a “bank plug,” a short-term gap filler between longer loans.
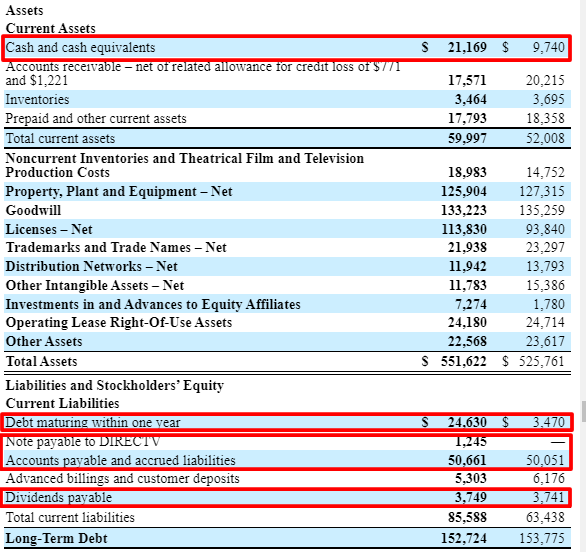
On AT&T’s balance sheet, you can see the line item in current liabilities for debt maturing within one year. These long-term bank loans mature within one year. In the cash flow statement, several line items show the payment of these amounts and more short-term financing initiated.
When investigating a company’s debt, looking at the notes in the financial documents section for more clarification is best.

AT&T’s short debt contains a mixture of commercial paper, credit agreement debt, and long-term notes maturing, but the rest equals the long-term debt coming due.
Sometimes, I feel like Sherlock Holmes is investigating to understand what a company is doing.
Accounts Payable
Another typical short-term debt is the liability known as accounts payable. Companies use this line item to show all payments to all outside vendors and shareholders. Let’s say that the company purchases equipment for $1 million on short-term credit with the vendor, which has a term of 30 days—the $1 million remains classified as an account payable.
Salaries and Wages Payable
Depending on how a company pays its employees, salaries, and wages might be considered short-term debt. For example, if the company pays an employee at the end of the month for work done in the previous month, it would create a line item in the current liabilities to account for those owed wages until paying them at the end of the month.
Lease Payments
Most accountants consider leases as long-term debts, but some leases serve their purpose in the short term and pay off within a year. For example, if a company leased space to bottle its beer for six months, that lease fulfilled a short-term purpose and added to the line item in current liabilities.
Accrued Taxes
Everyone’s favorite taxes! Some company taxes accrue over time but have not been paid to the government yet. Accrued taxes are taxes assessed to the company either on its earnings or property owed by the company.
Dividends Payable
Andrew and I’s favorite subject is dividends; the line item under current liabilities here lists dividends that have been declared but not yet paid. Again, this item is under the current liabilities; these are the monies the company owes to the shareholders before the end of the year.
Dividends payable refer to the dividend declared by the company.
“Dividend declared is that portion of profits earned by the company that the company’s board of directors decides to pay off as dividends to the shareholders of such company in return to the investment done by the shareholders through the purchase of company’s securities and such declaration of dividend creates a liability in the books of the concerned company.”
To break that down a little bit, dividends declared are the time when the company announces it will distribute dividends to shareholders. When this event is announced, the company creates a liability on its balance sheet to account for the distribution of dividends.
The timing of the balance sheet will indicate whether the declared dividends are issued quarterly or annually. Remember, the balance sheet equals a snapshot of the company’s financial situation at a given time.
When the company pays the dividend, it removes the liability from the balance sheet, and the cash flow statement will add the cash outflow to its record.
A note about taxes on dividends: The taxes don’t accrue until the company pays the dividend, and the company pays those taxes and distributes the dividends.
Unearned revenue
Unearned revenue equals money a customer advances to the company for work not yet completed but will finish in the coming year.
AT&T doesn’t have this line item on its balance sheet.
But for a time, unearned revenue represented part of Tesla’s revenue model; people would prepay for cars not yet built but promised to deliver within the year. Magazine subscriptions present another example; you prepay for the promise of receiving the magazines throughout the year.
How Do We Analyze the Impact of Short-term Debt?
Investors have several ways to analyze a company’s short-term debt and its impact on the business. We can assess a company’s liquidity by looking at its working capital. Excess working capital equals adequate cash to cover the short-term debt and provide growth opportunities for the company.
If the company operates on the short side of working capital, it may have liquidity issues and be forced to take on more debt to cover the difference.

We have a simple formula we can use to find the working capital.
Working Capital = Current Assets – Current Liabilities
Let’s look at Hormel’s balance sheet (HRL) to put this quick formula into action. The balance sheet is dated the year ending October 31, 2021. All numbers equal millions unless otherwise stated.
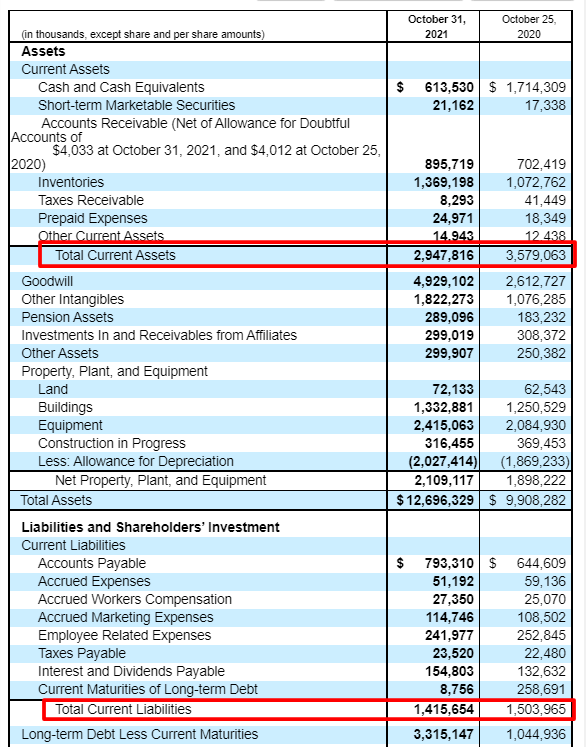
Let’s pull our numbers from Hormel’s balance sheet.
- Current Assets – $2,947,816
- Current Liabilities – $1,415,654
Now, to find the working capital for Hormel, we add our numbers to the above formula.
Hormel Working Capital = 2,947,816 – 1,415,654
Hormel Working Capital = $1,532,162
Hormel meets the first test and has adequate working capital to reach its current liability requirements and have enough to grow.
Another quick way to determine a company’s short-term liquidity is to utilize a few other ratios.
Current Ratio
The current ratio offers a quick way to compare the liquidity of peers when investigating a company. It measures the company’s ability to meet all of its current liabilities using the business’s more liquid assets.
A word of caution: a company with a high inventory level listed as a current liability would have a higher current ratio. However, inventory can take time to turn into cash, so it is best to use another ratio, the quick and current ratios, to get a full picture of a business’s liquidity.
Calculating the current ratio is simple as well.
Current Ratio = Current Assets / Current Liabilities
We can take the numbers from our previous example to calculate the current ratio for Hormel.
Current Ratio = 2,947,816 / 1,415,654
Current Ratio = 2.08
We should consider a current ratio above one good and 1.5. Even better, Hormel continues to manage its current assets versus its liabilities.
But remember what we discussed about inventories in the above section? Let’s look at the quick ratio to see if this holds.
Quick Ratio
The quick ratio is a great additional tool to measure the short-term liquidity of any business. It includes the same current assets and liabilities of the current ratio, but we also include inventories to give us a full picture of a company’s liquidity.
Let’s take a look at the quick ratio for Hormel.
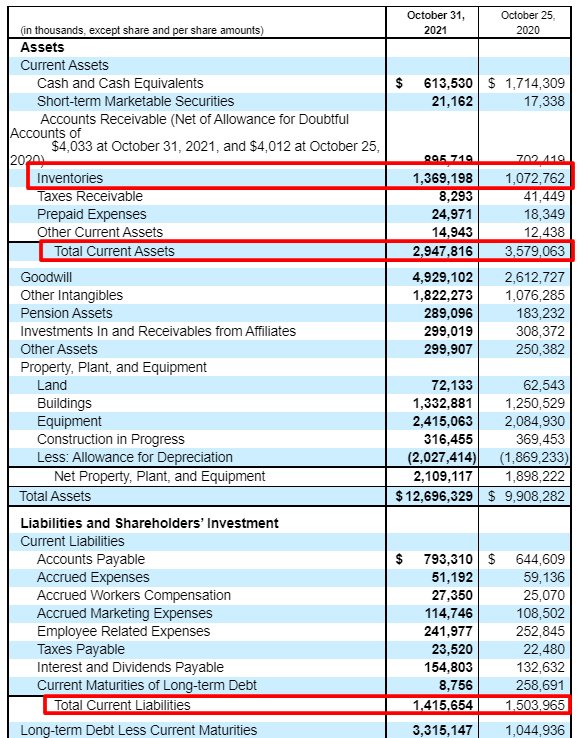
I am looking at the above balance sheet again.
The formula for the quick ratio:
Quick Ratio = ( Current Assets – Inventories ) / Current Liabilities
We are pulling the numbers from the above balance sheet.
- Current Assets – 2,947,816
- Inventories – 1,369,198
- Current Liabilities – 1,415,654
Plugging the numbers from above into the formula, we get:
Quick Ratio = ( 2,947,816 – 1,369,198 ) / 1,415,654
Quick Ratio = 1,578,618 / 1,415,654
Quick Ratio = 1.11
According to our calculations, Hormel carries sufficient current assets to meet its liquidity needs, but the quick ratio is lower than the current asset. If we had not seen Hormel continue carrying a lot of inventory on its balance sheet, the omission would have thrown our number off quite a bit.
A number below one would indicate that a company would have trouble meeting its current liability requirements.
A quick ratio is an acid test of the company’s financial strength.
Let’s look at a few more to give us a full flavor of how these ratios can work for us.
Next is Walgreen’s Boot Alliance (WBA), another dividend aristocrat.
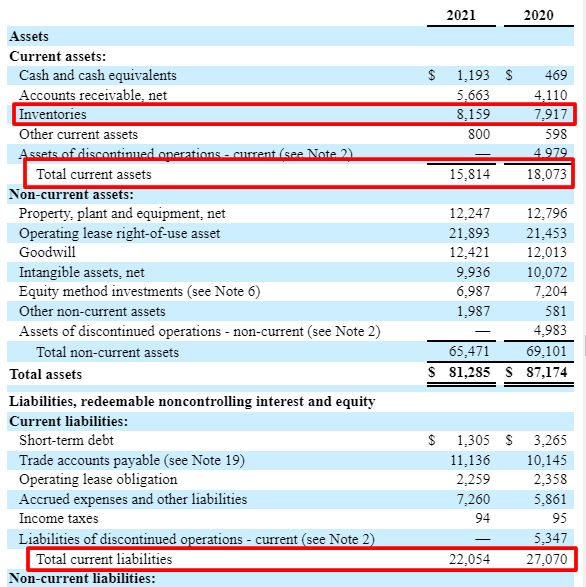
We are pulling the numbers from Walgreen’s balance sheet.
- Current Assets – $15,814
- Inventories – $8,159
- Current Liabilities – $22,054
Now that we have all our numbers, let’s calculate our ratios.
Current Ratio = 15,814 / 22,054
Current Ratio = 0.72
Quick Ratio = ( 15,814 – 8,159 ) / 22,054
Quick Ratio = 7,655 / 22,054
Quick Ratio = 0.35
Looking at Walgreens’s balance sheet, the company is experiencing a liquidity crunch, which I want to investigate further before buying. If you look at the previous year, the liquidity crunch appears to be a trend that I would want to follow.
For comparison, let’s pull some more numbers just for giggles.
The above chart gives us an excellent snapshot of some companies and their current and quick ratios. A few recent financial downturn poster children, Carnival and Boeing, continue feeling the short-term liquidity crunch.
When the market turns for the worse, like recently, you can see who was swimming naked as the tide has gone out.
Final Thoughts
Walking through the current liabilities and analyzing short-term debt remains a fantastic way to check the liquidity of a company you like. As we have seen, looking at short-term debt is easy, and once you understand the accounting terms, it makes much more sense.
Short-term debt includes more than loans a company takes out to get from point A to point B; it includes taxes, accounts payable, and dividends.
The ratios we use to analyze a company’s liquidity are quick and easy to calculate, and I would strongly encourage you to add those to your checklist. Using these ratios will help you determine two things.
- Number one equals the company’s financial strength position and has enough short-term liquidity to cover its debts.
- Number two is how the management has positioned the company to grow over the long term. By creating cash-creating assets, the management can continue to grow the company instead of focusing on funding to cover the shortfall in cash to cover the liabilities.
As you can see, the numbers don’t tell the full picture; we also have an element of management decisions about the company’s direction. We can use these ratios to see who continues swimming with their clothes on when the tide goes out because it will go out at some point.
As always, thank you for taking the time to read this article. I hope you find something of value in your investing journey. If you have any further questions or if I can be of any additional assistance, please don’t hesitate to reach out.
Until next time.
Take care and be safe,
Dave

Dave Ahern
Dave, a self-taught investor, empowers investors to start investing by demystifying the stock market.
