I’m going to need you to buckle your seatbelts and get ready…this is going to be an extremely bumpy ride as I take you through the history of the major periods of stock market volatility that we have experienced in the last 100 years! So, with that being said, ladies and gentlemen, start your engines!
Man, that was lame. Lol. But for real, get ready – this is going to be a heavy data blogpost about some extremely serious periods of stock market volatility that have occurred since 1928.
First off, why is the stock market so volatile in the first place? Well, it’s simple really. The stock market is nothing more than a bunch of shares of companies that the public owns, where the public dictates the price each day, simply based off what they’re willing to pay for those shares.
The thing is, people are absolutely insane. People don’t buy and sell stocks based off fundamentals, or at least not the majority of people. People buy and sell stocks based off what they hear from coworkers at the water cooler, or what they see on CNBC, or maybe even a shiny new company that just came off an IPO.
They sell their shares because a company has bad earnings call just to buy that stock back when it’s 10% higher because they don’t want to miss out on it.
People are the most unpredictable thing in the world, and it’s not only with investing, but with any facet of life. I once had an internship with a 3rd Party Logistics company and I called a truck driver to ask him if he was going to make the delivery on time. He said no. When I asked what the reasoning was, he responded with “I wanted to go to the casino.”
Wtf.
One of my favorite quotes about the stock market, in general, is from William Feather:
“One of the funny things about the stock market is that every time one person buys, another sells, and both think they are astute.”
How true is that. You’re selling or buying to someone else that is buying or selling those same shares and you both think you’re right, but you’re not. It just doesn’t work that way. But that is one of the many things, and in my opinion the biggest thing, that causes the stock market to be so volatile.
So, just how volatile is the stock market, actually?
Well it depends – Investopedia has a great article that talks about the 8 most volatile sectors which I thought was a great read to really get me in the mindset of this article. Volatility can be a good thing if you’re a level-headed investor as it presents opportunities to make money, so understanding the most volatile sectors certainly was a benefit!
“Andy, just tell me about the market in general!” Ok, fine – on your command!
Well, it’s extremely volatile. I went back and looked at data since 1928 and compared the changes in the S&P 500 pricing on a daily, weekly, monthly and an annual basis, to see how much it come change from marker to marker in each of those time periods, such as day-to-day, week-to-week, etc.
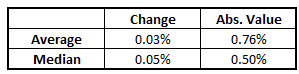
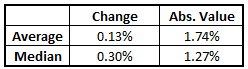
Let’s first start out on a day-to-day basis. Overall, since 1/1/1928, the S&P 500 has moved an average of a positive .03% each day and the median, which is simply the middle number, and the number I like just as much if not more than an average since it takes out the outliers, shows that the median day was a positive gain of .05%.
When I take a look at the absolute value, which is simply just turning everyday into a positive, the average daily move is .76% and the median move is .50%. I like to use absolute value when looking at a lot of things that can dramatically shift because if the S&P 500 goes up 4% one day and then down 4% the next day, it wouldn’t be telling the whole picture to say that the S&P 500 has been flat the last two days, when in reality it has made a 4% move both days, they just simply canceled one another out.
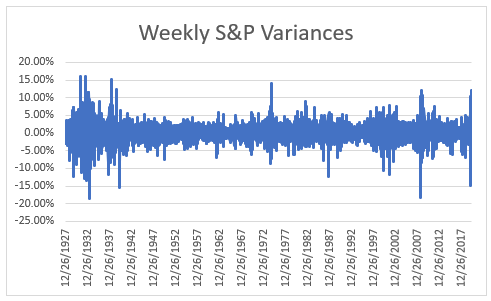
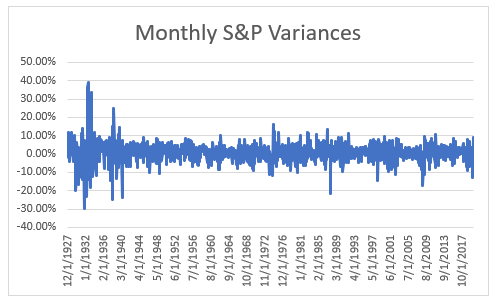
The chart below shows some of the major volatility that we have seen in the stock market since 1928. As you see the major spikes, either positive or negative, I’m sure that you could guess what was going on in a lot of these timeframes:
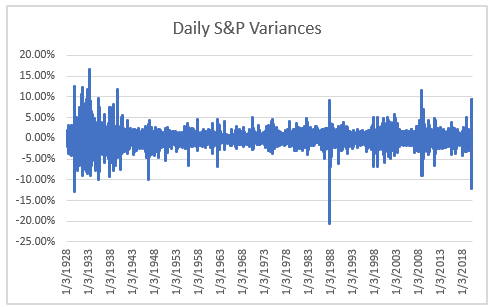
1930’s – Great Depression
1987 – Black Monday and a Stock Market Crash
2008 – Housing Market Crash
2020 – Coronavirus…is this the worst one yet??
The top 10 days that we have experienced with the highest volatility are below, and as I mentioned before, all likely are days that you might be familiar with. There’s a lot of the Great Depression in there and even a day just over a month ago from the coronavirus!
One thing that stood out to me was just how crazy the market has felt despite their only being one day in the Top 10 Most Volatile Days from 2020. Now, I know we’re not even four full months into 2020, and the Great Depression lasted 43 months, but still!
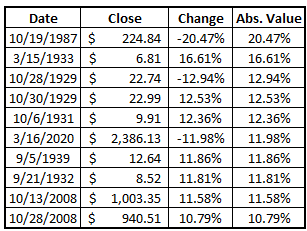
There was a total of 10 days that had a change in the S&P 500 of over 10% from the previous day, and 7 of those were during the Great Depression.
“Andy, that was soooo long ago – what does 2020 with the coronavirus look like?”
Well, let’s take a looksie!
Only 6 days from 2020 were in the top 100, but you might notice that 3/9, 3/13 and 3/12 were all in the same week…what a crazy week!

So yes, there are some major days of volatility, without a doubt, but let’s move on and look at the weekly averages.
The average and median moves are significantly larger than the daily moves, which makes sense as you have five days of moves if there’s a significant market downturn or rally during that week rather than just one individual day.
As you can see, the chart follows a very similar pattern to the daily changes, which makes a lot of sense, but there are higher highs and lower lows.
For the most part, the weekly data really does look very similar to the daily data. When I look at the 10 most volatile weeks below, I see that again, most were during the Great Depression. The week in March that I mentioned above where we had three weeks in the Top 50 most volatile days…yeah, you guessed it – that week made the Top 10!
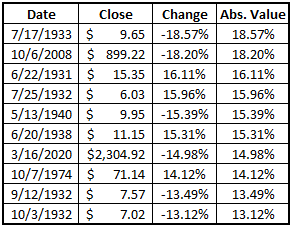
But two weeks were down 18%!! Can you imagine that? People must have been losing their mind. I know that I certainly would’ve been. It’s not too far off from what we had this year, but that extra 3% can add up pretty quick if you’re not mentally prepared for it.
A lot of the monthly data is more of the same, so I’m not going to provide a ton of context, but I do want to make sure you can see the data:
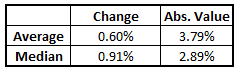
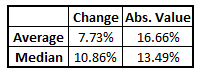
Staying with the same trend, the volatility is greater than the weekly, but it is almost more smoothed out over the long-term. The change is pretty high with an average/median of .60%/.91% and an absolute value change that’s significantly higher of 3.79%/2.89%. That’s a pretty hefty change if you think about how volatile the market is.
In essence, that’s saying that the average month will move 3.79%, either up or down, but after all the months are added together, the average change is only .60%. Nuts!
The top 10 months, again, the Great Depression and then when Black Monday occurred in October of 1987.
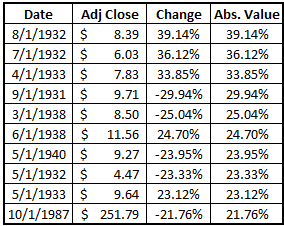
You might notice that 2020 is no longer on this list at all – the highest-ranking month of 2020 is March which is ranked as the 30th most volatile month since 1928.
Alright, we’re all about investing for the long-term (or are we?) so let’s go ahead and look at the yearly data!
Those are some pretty nice returns, right?? I’ve always talked about11% CAGR, or Compound Annual Growth Rate, since 1950 when you include dividends, but nearly 8%, without dividends, from 1928 which includes such an awful time like the Great Depression is pretty solid. The median is much higher, which means that we have had some really, really bad years that were essentially thrown out as outliers when you just take the middle year.
When were those years? Yep, you guessed it – The Great Depression (down 51% in 1932), Housing Market Collapse (down 40% from 2008 – 2009) and then the Recession of 1937 – 1938 (down 40%).
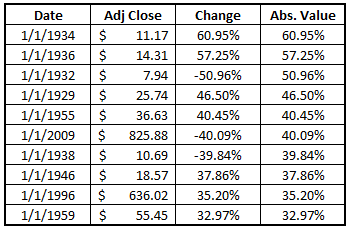
Sorry, I switched up the order on you – I couldn’t tease you with three of the worst years and not show the best years! Do you know what stands out to me? A lot of the best years are in the same timeframe as the really bad years too. Interesting…
Think this is a trend? Guess what – it is. Investing after a bad year typically will get you great returns!

That’s a pretty nice-looking chart, too. I like the volatility because I think that volatility indicates a healthy market. I like to see things swing around because that means that there are buying opportunities available as long as you’re a keen investor.
So, to take one last step and get even further into the data, I mapped a chart to show the frequent that the S&P 500 volatility fluctuated on a daily, weekly, monthly and yearly basis by X%. For instance, let me just show a small portion below to explain:
Essentially, I bookended both sides at a +/- 10% change in the S&P 500 and then broke it up by individual percentage increments the rest of the way.
For instance, in the picture below, you can see the four different time periods for -10%+, so anything that’s a -10% change or worse, which is 2.80% for ‘Monthly’. That means that 2.80% of the months since 1928 have resulted in a change of -10% or worse from the previous month.
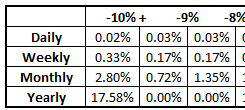
The next section shows .72% and is between the -9% and -10%+ grouping, indicating that .72% of the months since 1/1/1928 have resulted in a change that’s between -9% and -10% since 1/1/1928. The next cell is 1.35%, showing that 1.35% of the months had a change between -8% and -9%.
Sorry if it seemed dry there, but I wanted to hammer home that the numbers are ranges in between the two numbers that are shown, which is why they’re in the middle of the percentages.
Below is the full image that shows the entire sector of the data:

Click to zoomAs you can see, the bookends on the annual data are nearly 3 times as much as the -10%+ section, meaning that we’ve had much higher highs on a yearly basis than we do with lower lows. As expected, most of the daily data is centered in the first few percentiles and then it spreads out rapidly as the timeframe increases. Below, I have the same screenshot, but I highlighted the percentage ranges needed to include ~ 95% of all results:

Click to zoomFor the daily, over 93% of changes are included in a range of +/- 2%, while that range increases all the way to 5% just for a weekly basis. On a monthly basis, you have to go to the 10% range and then for an annual basis, the entire data points need to be included.
So, how can you use all of this data for you to be a better investor? Well, I have really two main takeaways:
1 – You Have to Trust the Market
Trust that the market is going to do what it has always done – perform! The market historically has provided great returns. If you can trust that this will continue to happen and just focus on benchmarking your performance to an index then you’re going to be a much, much better investor for it. You won’t think of your portfolio as losing 15% if the S&P 500 lost 18% – instead you will look at it like you outperformed the market by 3% – that is a huge change in perception and can keep you from making irrational decisions
2 – Investing Long is Never Wrong
The long-term has shown periods of great success and while it can be very volatile, your odds of positive performance are greater than those in the short-term. Since, 1928, take a look at how often each timeframe simply was either positive or negative:
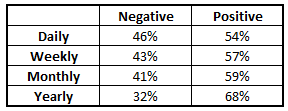
It’s not a coincidence that the positive outcome percentage increases each timeframe…stay focused on the long-term. I have some things that are short-term in my own portfolio, but that’s for a completely different strategy and I have a different mindset going in. if you’re making one bet for the rest of your life, always remember…
Investing long is never wrong!!
