Updated: 6/9/22
There are many facets to analyzing a stock. You can do well by selecting a great business, or by buying a stock and selling it at a higher price.
A simple stock price analysis can tell you if a stock is cheap and likely to trade back to where it should be (higher) and/or identify a stock moving with momentum.
In this post, I’ll provide a summary of some of the basics of fundamental and technical analysis which can be used to analyze a stock based on its price, while also offering additional solutions for investors looking to take their analysis to the next step.
Here’s the breakdown for this post [Click to Skip to]:
- Fundamental Analysis on a stock
- Technical Analysis on a stock
- Investor Takeaway
The Case for Fundamental Analysis
Fundamental analysis describes the procedure of evaluating a stock based on the numbers found in its financial statements. Since a stock represents part ownership in a business, it makes sense to analyze the business in order to understand if you want to buy the stock.
Some of the most successful investors have utilized fundamental analysis as their investment philosophy—Warren Buffett, Peter Lynch, and Joel Greenblatt, just to name a few.
Characteristics to describe investing using fundamental analysis include:
- No worries about short term price fluctuations
- Achieving compound interest over the long term through the business
- Additional compounding from dividends and their reinvestment
- Looking at business results rather than stock charts
Though the fundamental analyst doesn’t worry about what the stock chart says, he or she can use a stock’s price to identify when a stock is cheap, and in order to sell it later at a profit when it rebounds.
That strategy is also known as value investing, and has been used by many top fundamental analysis practitioners.
Price-based valuation ratios
The most well-known price based valuation ratio is the P/E, or Price to Earnings, ratio. This is often one of the first ratios that investors will learn about, and its concept is simple.
An analyst uses a stock’s price and compares it to its earnings to make a general assumption on whether the stock is relatively cheap or expensive.

Some other valuation ratios commonly used for a stock price analysis like this include:
- Price to book value, or P/B ratio
- Price to sales, or P/S ratio
- EV to EBITDA, or Enterprise Value divided by EBITDA
- Where EBITDA = Earnings Before Interest, Taxes, Depreciation, and Amortization
These ratios are covered in-depth in a fantastic post about relative valuation by Dave Ahern, and you can use combinations of these ratios to determine a stock’s attractiveness based on its current price in the market.
You can also use these price based ratios as a great comparison tool: comparing to (1) historical values and (2) to competitors.
Price lower than historical average – this technique works because of a stock price’s (and its fundamentals) tendency to “revert to the mean”. A free market encourages reversion to the mean because of its competitiveness.
For example, an industry with high profit margins will attract lots of competitors. These new competitors will drive margins lower until they revert to a certain point, or mean. On the flip side, lower margins cause competitors to leave or quit, which eventually raises margins back to the mean.
So, buying lower than the mean can create profits for the investor as a stock reverts to the mean, thus making a historical stock price analysis a useful (potential) source of investment returns.
Price ratios compared to competitors – as industries have different fundamentals and capital requirements, price-based ratios like the P/E can be more useful when compared across competitors rather than just compared to the market as a whole.
A price ratio comparison to competitors can help identify a stock that is (potentially) unfairly looked down on in the stock market (and thus trading cheaply). This analysis can also uncover stocks that have relatively higher fundamentals—like earnings or sales—compared to their price, representing better (potential) deals or “bang for your buck” when buying the stock.
Example Fundamental Analysis Screen
My favorite screening tool is a free one called FINVIZ, and you can use it to find stocks that are trading at great price-based valuation ratios.
What’s great about doing this is that you can sift through a sea of thousands of stocks, and narrow it down to a list that’s easier to digest.
One downside to this is that it can lead you to buying the cheapest of the cheap stocks or industries, which may not be the best approach at any given time.
However, it’s a great place to start, and practice, stock price analysis.
Say I’m bullish on technology stocks and want to see if there’s any decently priced deals left. As an example fundamental analysis screen, I’m going to set the following criteria in FINVIZ: Index = S&P 500, Sector = Technology, Country = USA, Dividend Yield = Positive, P/E = Under 30, P/S = Under 5.
The FINVIZ screener returns a list of 15 stocks, as you can see with this screenshot:
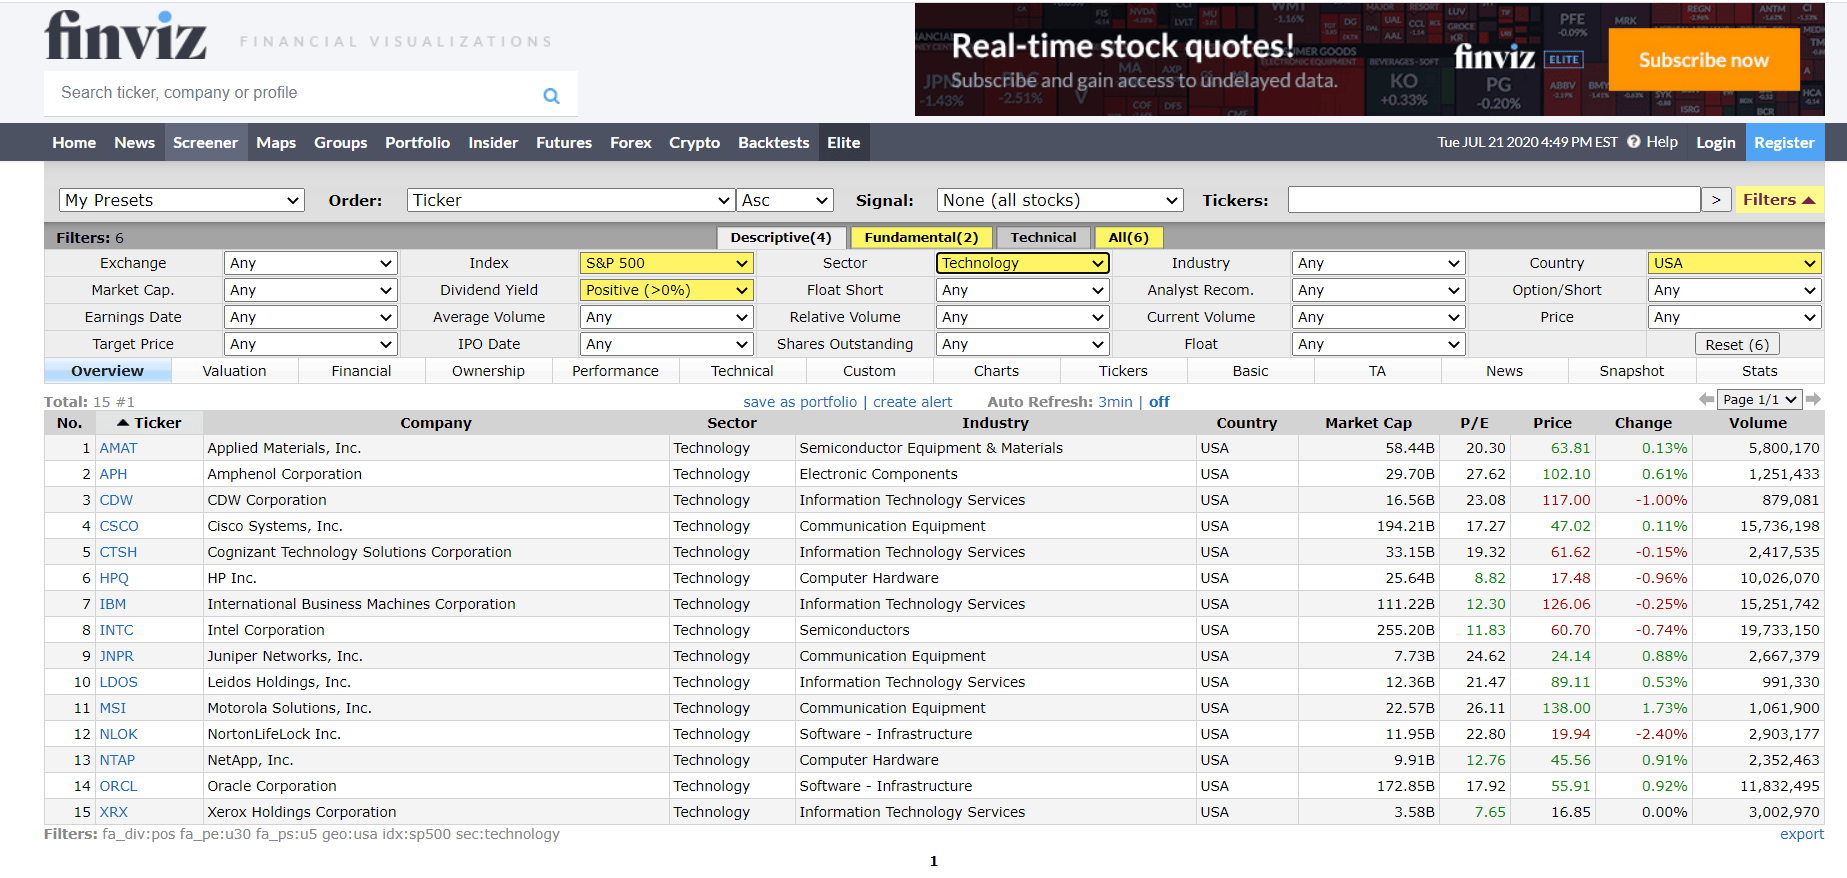
Click to zoomAs I’ve gotten more experience as a fundamental investor, I’ve found I’m relying less on screens and more on just using stock price analysis to get a general idea.
I’ll find an industry or theme that I’m very bullish about, and then use price ratios to make sure that it’s not wildly overvalued. From there, the real work begins, and that’s what I’ll touch on next.
Achieving True Understanding in Your Analysis
One of the things that I’ve been most passionate about lately is in really understanding what a business does and how that can impact the likelihood of its long term success. Doing this means finding what your circle of competence is, and then utilizing it for great stock analyses that have a high probability of being correct.
The perfect example of this is Warren Buffett’s investment in Coca Cola. This was a stock that made up as much as 40% of his portfolio, and returned 20%+ for years.
Buffett recognized Coca Cola as a great investment from his previous success with another consumer brand company, See’s. He saw, through the financials and the brand’s ability to inspire loyalty and profits, that this was a business that could compound capital for a very long time to achieve fantastic levels of growth.
That’s exactly what happened.
And how does Buffett achieve mastery over the stocks he analyzes? Simple. He reads.
“My policy [is] reading every annual report in sight that can further my knowledge about anything.” -Warren Buffett
“I read and read and read. I probably read 5 to 6 hours per day. I read five daily newspapers, I read a fair number of magazines, I read 10k’s, I read annual reports, and I read a lot of other things too. I’ve always enjoyed reading. I love reading biographies for example.” –Warren Buffett

It’s not just uncle Warren who reads lots of 10-k’s in order to find ideas for stocks and sort his thoughts about them. Jim Rogers was another famous fundamental analyst, who co-founded The Quantum Fund with billionaire George Soros and helped it become one of the best hedge funds, ever.
He says he got the following advice from an older gentleman on a plane:
“If you get interested in a company and you read the annual report, you will have done more than 98% of the people on Wall Street. And if you read the footnotes in the annual report you will have done more than 100% of the people on Wall Street.”
That’s exactly what Jim Rogers did too, and like I said, his track record stands for itself.
If you really want to know the stock you are analyzing, and the business prospects behind that stock, then you really owe it to yourself to read the 10-k for the company, and the 10-k’s of the companies that compete with it.
I know that reading the 10-k is a daunting task for beginners, which is why we created a resource to guide you through it: Dissecting the 10-k Annual Report [A Guide].
To summarize the most critical steps of analyzing a stock (and its price):
- Comparing price ratios
- Historically
- Against competitors
- Understanding the analysis
- Reading company 10-k
- Reading competitors’ 10k’s
The Case for Technical Analysis
Technical analysis involves looking at the price chart of a stock and using it to formulate buying and selling points. The premise behind technical analysis is that prices tend to move in trends, and it’s possible to profitably trade in and out of these trends/ momentum using price chart analysis.
One famous trend follower, John Henry, was quoted as saying:
“I don’t believe that I am the only person who cannot predict future prices. No one consistently can predict anything, especially investors. Prices, not investors, predict the future.”
As the stock market is an emotional place, full of biases and expectations, it’s these emotions that move prices up or down and can contribute to much of the volatility seen in the market.
A few common technical indicators can be used by traders who are interesting in riding momentum or trend following to achieve returns.
A simplified summation of technical analysis for evaluating stocks:
- Business fundamentals don’t matter
- Compounding comes from gains and losses on trades
- Can be a short term OR long term strategy
- Less focus on dividends than with fundamental analysis
Technical indicator: Moving Averages
The idea behind a moving average is simple. Select a time period of trading, and look at the stock price history for this time period. Then, look at where the stock is currently priced, and compare that to this historic period. If it’s above, then the stock is trading above its moving average, and is a bullish signal.
Common simple moving averages include:
- 20-day
- 50-day
- 200-day
When a stock crosses over its simple moving average, it can be thought of as “breaking out” of its range. Oftentimes there can be a fundamental reason behind the break-out, and so in some ways technicals and fundamentals are inexorably connected.
These moving averages are just a start to stock price analysis using technicals, and can be combined or adjusted to create more advanced signals (such as how the simple moving average is a component of the moving average convergence divergence, or MACD).
A great resource for more in-depth analysis on moving averages can be found here.
Technical Indicator: RSI
Relative strength is interesting because instead of trying to find momentum that’s currently happening, the RSI tries to put the investor/trader in a position to enter before a likely turnaround.
The calculation for the RSI is a little more involved, and is worth researching if you’re interested, but it’s a value that fluctuates from 0-100%, where the values 30 and 70 are thought to be common indices of points where a stock can be “overbought” or “oversold”.
Using this strictly price only analysis approach, a signal like the Relative Strength Index tries to identify places where investor emotions are too high, unfairly swinging higher or lower than where the stock price should ideally settle—interestingly, a similar concept to value investing in a way.
Like the simple moving averages, the RSI can be (and often is) combined with other technical analysis metrics such as the MACD to create strategies that are likely to be more successful.
Example Technical Analysis Screen
Like with fundamental analysis, you can also use FINVIZ for your technical analysis needs. The screener takes the current stock price and filters out stocks based on the criteria you set for the various metrics.
Andy Shuler did a fantastic blog post uncovering the data behind momentum stocks, and showed the power of FINVIZ for finding specific entry points with either moving averages and/or RSI.
I’ve included a screenshot with one of his sample screens (which in this case combines fundamental and technical analysis):
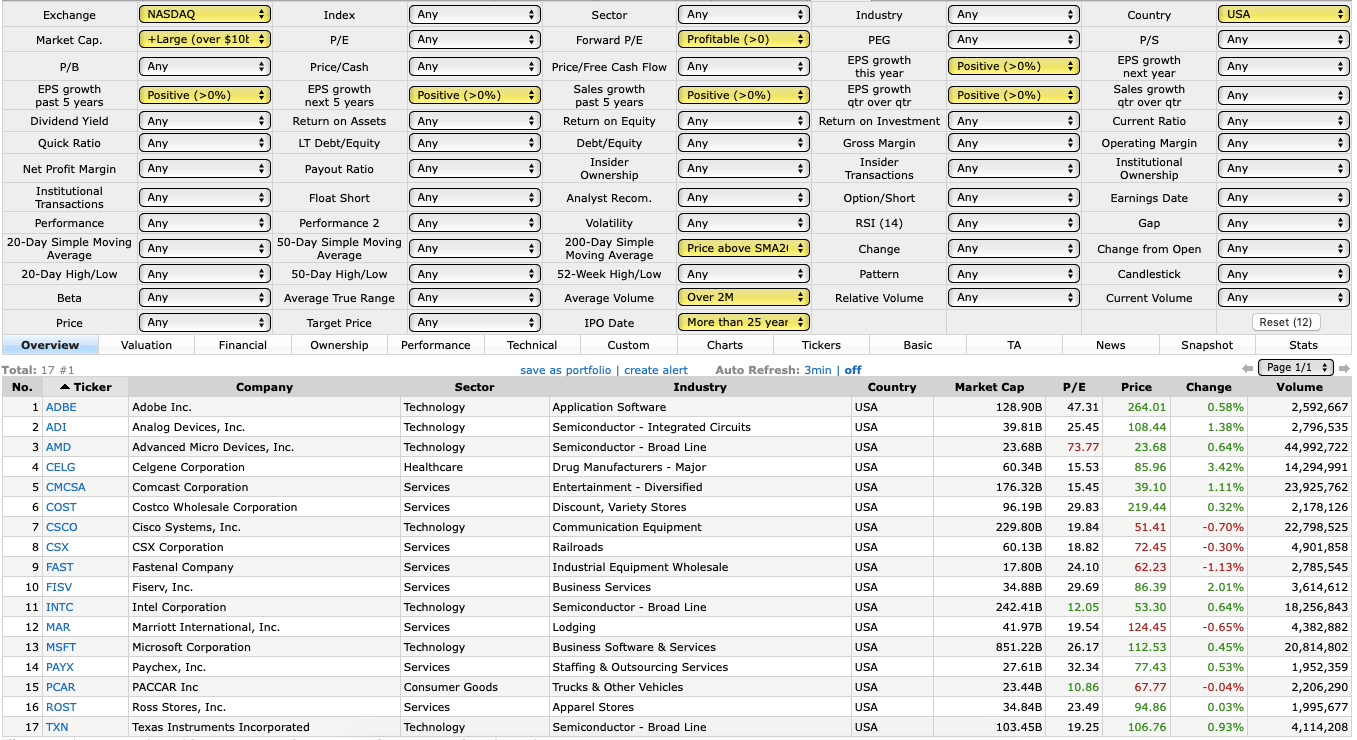
Click to zoomAs you can see, there are a myriad of options that you can use for stock price analysis using technical techniques, fundamentals, or any combination in between.
Investor Takeaway
Whether you choose to use one or all of the tips provided in this post, it’s important to remember that the best analysis is the one that you understand most—meaning:
- You understand the strengths of your analysis
- You understand the weaknesses of your analysis
There are even more advanced techniques for estimating the value of a stock that are classically used in finance such as the Discounted Cash Flow Model and Gordon Growth Model, among others.
For investors who are serious about fundamental analysis, I’d highly recommend going through these guides:
- Value Investing for Beginners
- Using a DCF Like Warren Buffett Would
- (Another) Simple Guide on Evaluating a Stock
However, at the same time, don’t get overwhelmed by all of the options.
Find one that appeals to you, and go down the rabbit hole and see what sticks.
Knowledge grows like compound interest, and you’ll be amazed by how your analyses can exponentially improve over time as you continue practicing them.
Since I’ve been quoting Warren Buffett a lot in this post, I’ll leave you with a relevant quote from his partner, Charlie Munger: “Go to bed smarter than when you woke up.”
