As we discussed in part 1 of this dividend mini-series, there is much focus on the past dividend growth of a stock– yet this doesn’t give a complete picture on well a company really performed.
Go back to part 1 to get background on WHY we need a better metric to measure a stock’s dividend growth as it relates to other parts of a company’s financials.
This is one of the two new dividend ratios that I recommend be added to a dividend investor’s toolkit to better analyze and appreciate the stocks that have historically allocated capital well while also rewarding shareholders sufficiently.

Let’s talk about the first dividend ratio I believe we should be focusing on, which is a simple modification on a few metrics already commonly used by investors.
I call it: Business-based Dividend Growth Rate (10 Year).
For this first metric, we want to discover businesses that have grown their dividend at an excellent rate while also growing the business, with the likelihood that such an excellent growth rate can continue.
We want to discover businesses that grew their earnings alongside the dividend in a way that was sustainable by avoiding crippling long term financial health of the company.
And we want to find the managements that allocated capital efficiently– avoiding those that either paid too much in a dividend and achieved subpar growth or those that paid too little in a dividend and received a low return on reinvested capital.
Why 10 Years of Dividend Growth data?
First, let’s talk about why I used 10 years as the time period to examine. For one, it should be obvious that any and all of these metrics can vary widely in the course of any selected year.
The reality of business and industry is that there are natural cycles, and that many aspects of business can fluctuate widely from year to year while general long term growth remains intact. There’s too many factors to list that can influence this, so I won’t bother to list them.
Secondly, I’ve seen the 10 year period referenced in two ways: (1) By Benjamin Graham in The Intelligent Investor when he talks about analyzing a company’s growth (2) 10 years of consecutive dividend growth is a commonly used metric by many dividend growth investors online– once a company reaches this point they draw a lot more attention as they become part of this coveted group of DGI stocks.
Lastly, there’s going to be a difference between the 10 year growth rate and the 10 year component of true payout ratio which we’ll discuss in part 3.
In the case of evaluating growth, it’s not a reliable system if you’re just taking 1 year and comparing it to 10 years ago. All of the reasons you don’t want to just take a 1 year measurement of growth also applies to taking one 10 year snapshot.
Let’s use 2018 and 2009 (10 year prior) as an example, and let’s say we’re looking at EPS. Either year, 2018 or 2009, could fall at any point in the business and economic cycle.

If one year happens to fall in an extreme peak or valley of a cycle, as 2009 happens to be, then the 10 year EPS growth rate can be accentuated one way or the other.
In this example, since 2009 was generally a bad year for business, taking a 10 EPS year growth rate from 2018 to 2009 will liekly lead to a much higher growth rate than any other measurement period– which would give us an innacurate representation of the true business growth.
So to counteract that, I propose taking a 3 year average and comparing it to the 3 year average of 10 years prior, and that will determine the 10 year growth rate.
Going back to our example, that means instead of just taking 2018, you’re taking the average of the EPS recorded from 2016-2018.
Then, you take the 3 year EPS average from 10 years’ prior, which is 2007-2009.
Now that you have the two averages, you can run those through a CAGR calculator (use 10 years as your period) and get a more accurate representation of what the annualized growth will report and what kind of long term growth the business really accomplished.
The BB Div G Rate Calculation
This will be a simple calculation and will achieve all of the above.
BB Dividend Growth Rate = 10 Year Dividend Growth – (EPS modifier) – 10 Year Debt to Equity Growth
where
If 10 Year EPS Growth is greater than 10 Year Dividend Growth, then the EPS modifier = 0. If 10 Year Dividend Growth is greater than 10 Year EPS growth, then:
EPS modifier = (10 Year Dividend Growth – 10 Year EPS Growth)
Here’s what each component of this formula achieves.
A company that grew their dividend rate faster than their EPS won’t be able to do that indefinitely. An ideal state is a company growing their EPS and dividend at around the same rate. But we don’t want to punish companies if their dividend growth rate is lagging EPS growth rate just because the business is doing so well.
We do want to identify companies that aren’t growing the dividend that much, which is why 10 Year Dividend Growth is the starting point of the BB Dividend Growth Rate.
We also want to identify stocks where the dividend is growing faster than the EPS, because not only is this an unsustainable condition but it also can identify businesses where management is growing the dividend too aggressively just to appease dividend investors.
That’s where the EPS modifier comes into play.
The higher the EPS modifier, the more the dividend growth has outpaced the EPS growth, and the less that a stock’s dividend history represents an underlying business that is truly performing well.
Importance of the Debt to Equity Growth Metric
Finally, we have 10 Year Debt to Equity growth, which simply gets subtracted from 10 Year Dividend Growth. This component will highlight any companies that have grown their dividend by accumulating more debt.
Again, this is unsustainable because you can’t just keep adding on debt forever. It identifies those businesses that aren’t truly growing their business through reinvestment, but through leverage instead. This is something to avoid.
An extra detail for this metric that we must consider and discuss further.
Say that a company has paid down debt and so their 10 year Debt to Equity is negative. This makes the BB Dividend Growth Rate higher, and can make those companies not currently paying dividends at a high rate appear better than those that actually are growing the dividend.
While this may seem like a bug and not a feature, I argue that this is actually preferable.
In the same way you can’t lever up forever, you also can’t deleverage forever. The end point of paying off debt is becoming debt free. So a company that is paying off debt today (or in the past 10 years) is “sacrificing” today’s performance for better future performance. This is likely to result in higher dividend growth rates in the future.
The key word there is likely. Of course there’s no guarantees that better dividend growth will result from a deleveraged balance sheet, but there’s no guarantees with any of these metrics.
We’re trying to identify the businesses that have allocated capital back to shareholders through either dividends or a better balance sheet. If the company so aggressively pays off their debt that there’s no dividend actually paid to the shareholder, this is something that metric #2 will quickly identify.
So the BB Div G rate achieves what we want to see, which is a company returning value to its shareholders and doing so without burning too much of its EPS (leaving none for reinvestment) and without levering up.
The stocks that score high in this first metric will commonly be the ones that have allocated capital efficiently– reinvesting in the business for higher EPS growth AND actual dividend growth that the investor sees as income.
The Effect of Share Buybacks on BB Div G
You might notice that share buybacks don’t fall into the equation here. You do see higher EPS from share buybacks, so that will have an effect on the BB Div G. While it can help the BB Div G, as higher EPS leads to a better EPS modifier, it by itself doesn’t raise the BB Div G. Which is again, what we want to see.
I’ve talked in-length about why I prefer dividends to share buybacks, and this part of the calculation enforces that preference.
In essence, a company returning capital to shareholders through buybacks is nice, but at the end of the day I want a constant and growing income stream. Companies that are overly aggressive with share buybacks at the expense of dividends should not be rewarded as they aren’t returning capital to shareholders in the best way that actually benefits shareholders– if there isn’t sufficient dividend growth and/or dividend payments.
Example: Lowe’s ($LOW)
Let’s look at the Business Based Dividend Growth (BB Div G) of Lowe’s, a popular Dividend King that’s notorious for being a fantastic dividend compounder.
As a reminder, the equation for BB Div G is:
BB Dividend Growth Rate = 10 Year Dividend Growth – (EPS modifier) – 10 Year Debt to Equity Growth
I highly recommend doing all of these calculations yourself using a company’s 10-k, rather than relying on other financial websites with big databases (where there can be errors from the scale of large data transfers). And you should also calculate the 3 year averages instead of relying on these growth calculations, I’ll show an example of that below.
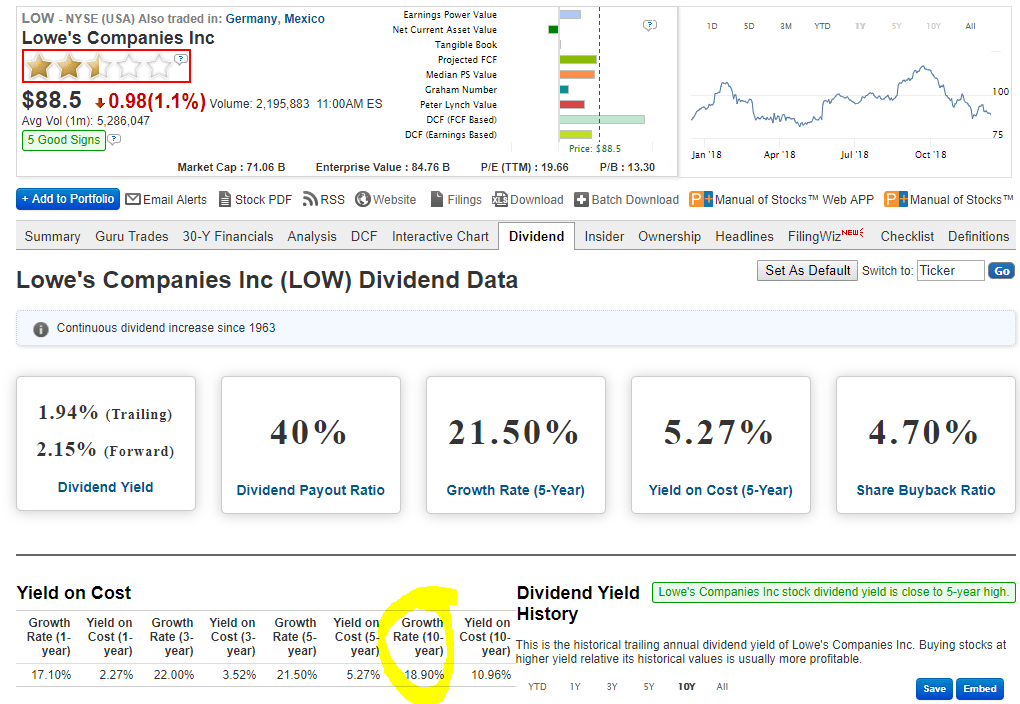
To find the 10 year dividend growth, we can use a resource like GuruFocus to see this for free. It shows 18.9%. Here’s a screenshot of where I found that first metric:
Next let’s calculate the EPS modifier. As stated above, that number will be calculated the following way: If 10 Year EPS Growth is greater than 10 Year Dividend Growth, then the EPS modifier = 0.
If 10 Year Dividend Growth is greater than 10 Year EPS growth, then EPS modifier = (10 Year Dividend Growth – 10 Year EPS Growth).
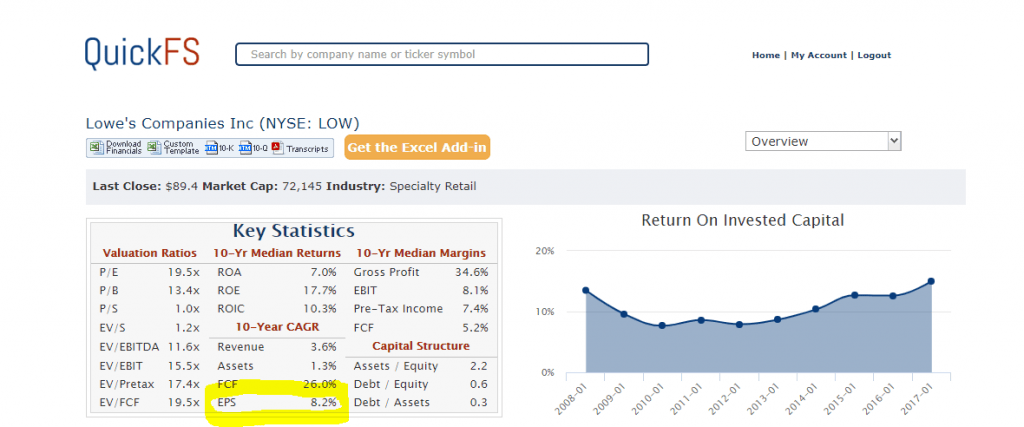
To find the 10 Year EPS growth, I’m going to use quickfs.net. That one is 8.2%. Here’s a screenshot showing where to find that metric for $LOW.
To calculate EPS modifier, we need to see if 10 year EPS growth (8.2%) is greater than 10 Year Dividend Growth (18.9%). It’s not, so EPS modifier is the 10 Year Dividend Growth – 10 Year EPS Growth, or 18.9 – 8.2 = 10.7.
Debt to Equity and 3 Year Average Example
For this last calculation, we’re going to have to use a company’s 10-k– as the Debt to Equity ratio is calculated differently depending on what website you’re on.
But for the purposes of this example just to show how this equation can be easily calculated, we used a few shortcuts like quickfs and Gurufocus for the first two. But you should actually calculate the 3 year average of dividend growth and EPS growth in the same way as here, for all of the reasons discussed previously.
For 10 year Debt to Equity Growth, I’m simply using the latest 10-k for $LOW which is 2018.
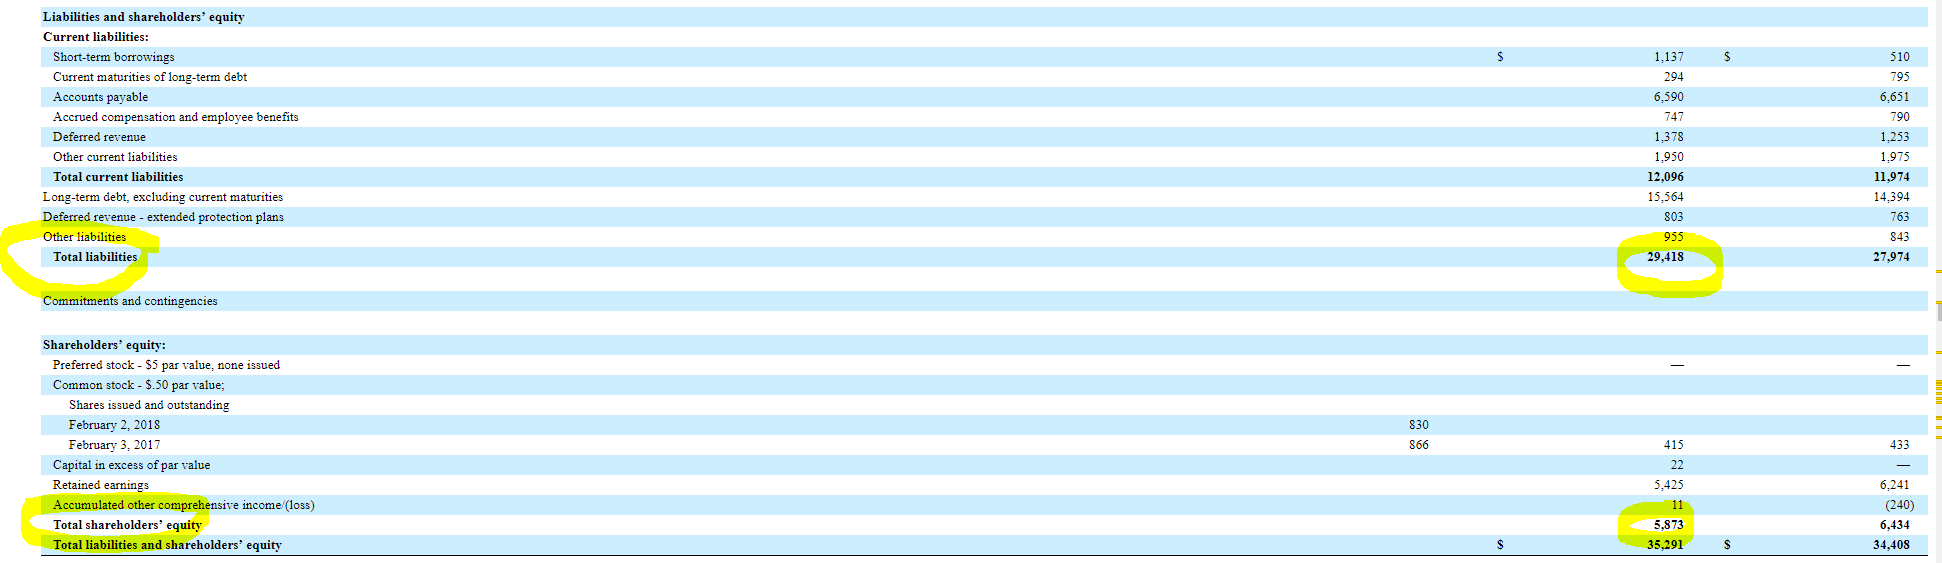
Using my browser’s search function (“ctrl+f”), I scroll down to the company’s “consolidated balance sheet”. I want two figures: Total Liabilities and Shareholder’s Equity. For 2018, those are $29,418 and $5,873 respectively (in millions).
To get the latest 3 year average, we’ll also need 2017 and 2016. For 2017, those are simply $27,974 and $6,434. Then I need to look at last year’s 10-k to get 2016. That comes out as $23,612 and $7,654.
Sidenote: I see declining shareholder’s equity and rising total liabilities, both of which aren’t good signs. Anyways, back to the calculation.
The 3 year average of these values returns:
Total Liabilities = (29,418 + 27,974 + 23,612) / 3 = 27,001
Shareholder’s Equity = (5,873 + 6,434 + 7,654) / 3 = 6,654
Debt to Equity = Total Liabilities / Shareholder’s Equity = 27,001 / 6,654 = 4.06.
Now we need to look at data 10 years prior, so that would be 2007-2009 and take those 3 year averages in the same way. The financial data is hidden in Exhibit 13 of the 10-k here, which can sometimes be the case.
Total Liabilities (2007, 2008, 2009) = 12,042; 14,771; 14,631
Shareholder’s Equity (2007, 2008, 2009) = 15,725; 16,098; 18,005;
Total Liabilities 3 yr avg = (12,042+14,771+14,631) / 3 = 13,815
Shareholder’s Equity 3 yr avg = (15,725 + 16,098 + 18,005) / 3 = 16,609
Debt to Equity = Total Liabilities / Shareholder’s Equity = 13,815 / 16,609) = 0.83.
Now, take those figures into a CAGR calculator to get the annualized growth rate over 10 years. Enter inital value = 0.83, final value = 4.06, and time period = 10.
The result: 17.2%.
Let’s go back to the original equation and input all of our values now.
BB Dividend Growth Rate = 10 Year Dividend Growth – (EPS modifier) – 10 Year Debt to Equity Growth
BB Dividend Growth Rate = 18.9 – 10.7 – 17.2 = -9%.
Conclusion
That’s a pretty bad value, and for good cause. When a business adds as many liabilities as $LOW did, it can’t do that much longer. They’re going to have to either sacrifice the great dividend growth they’ve seen, or attain outsized results in the future. The same logic applies to the EPS growth lagging the dividend growth.
A calculation like we’ve done here is a fantastic example of an indication where a company’s real business growth has not matched their dividend growth payments, and is therefore most likely unsustainable.
Comparing this to another great dividend growth stock with a better BB Div G ratio should make a buying decision between the two much easier.
The next step, once you’ve found stocks that are truly growing their dividend alongisde real business growth, is to find stocks that are paying a high enough dividend to make it worth your investment. You want to find managements that are returning capital to shareholders at a sufficient rate.
For this, you’ll want to move on to part 3 of this dividend ratio series, where I talk about the importance of finding a true payout ratio– and how to do it.
Dividend Ratios Pt. 1: Evaluating the Dividend History of a Stock
Dividend Ratios Pt. 2: How to Identify Sustainable Dividend Growth
Dividend Ratios Pt. 3: Measuring a Stock’s True Dividend Payout Ratio
Dividend Ratios Pt. 4: Combining Two New Metrics & Putting It All Together
