Understanding the concept of pre-tax and after-tax investment income is an imperative part of the financial planning roadmap. It is the net after-tax return that adds to your retirement savings, so it is important to plan your long-term investment returns and financial plan based on these real after-tax dollars.
This article will teach investors about the various types of income that investment returns can be attributed to and how to mathematically calculate the after-tax investment return for a portfolio. Our example will then go a step further and compound growth of that portfolio far into the future to highlight differences in after-tax return across account types.

Tax drag refers to the negative effect taxes have on gross investment returns. Different assets such as stocks, bonds, or REITs have different types of income that will be taxed in different ways. The difference in after-tax income adds up over time as the compounding effect of returns takes hold. Minimizing taxes is critical to strong long-term financial planning goals. While tax rates and rules are different across countries and states, it is normally the least risky and active return that gets taxed the highest (i.e. interest income).
Along with our goal at eInvesting for Beginners to make quality investing knowledge accessible to retail investors, we are sharing our Excel template for the after-tax return calculator and compounder used to create this article’s example! IFB’s products page has more guides and products to get investors knowledgeable and excited about confidently handling their own investment decisions. As every investor’s situation is unique, items such as tax rates, return allocation, and annual contributions per account type can be adjusted in the template. In real life, an investor’s consolidated portfolio has numerous accounts so our example and free template will look at consolidated after-tax returns across various margin, tax-free, and tax deferred accounts.
After-tax return analysis is an important part of financial planning and is commonly taught at universities and professional courses such as the CFA. Understanding taxes and which type of investment return to target in taxable accounts, tax-deferred accounts, or tax-free accounts is something we introduced investors to in another article on tax-efficient investing written previously. For investors starting their financial planning journey, I would suggest tuning up their tax knowledge with this article first before stepping into the math.
How to Calculate After-Tax Returns
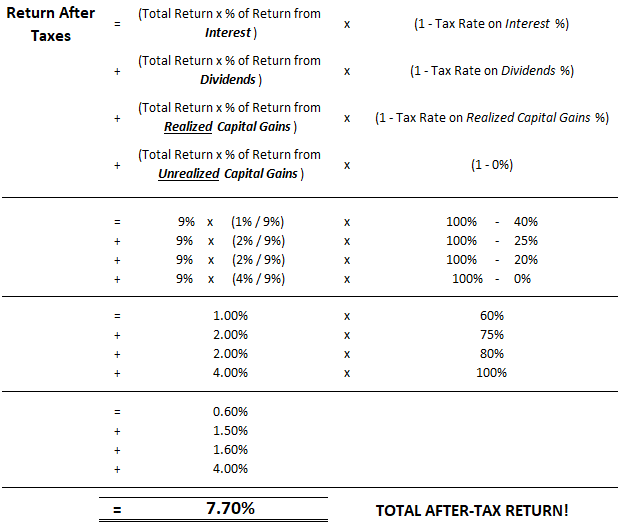
To calculate after-tax returns, first attribute the annual return on the portfolio between the types of income (dividends, interest, and realized/unrealized capital gains). Next, multiply the percentage each income type represents of total returns by the specific gross pre-tax return for that asset. We are now sitting with the gross return for each income type, weighted by its share of the portfolio’s gross returns.
This weighted gross return per income type is then multiplied by one minus the tax rate specific to the income type to calculate the final after-tax return for that specific piece. Adding up all the weighted returns by type then gives the total portfolio’s weighted average after-tax return as can be seen below.
Return After-Taxes (1) = (Total Return x % from Interest)(1 – Tax Rate Interest)
+ (Total Return x % from Dividends)(1 – Tax Rate Dividends)
+ (Total Return x % from Realized Cap Gains)(1 – Tax Rate Cap Gains)
+ (Total Return x % from Unrealized Cap Gains)(1 – 0) *zero as not taxed*
The main type of deferred tax investors will encounter are capital gains. As capital gains are taxed at a future point in time, there is a tax benefit to any portion of returns being attributed to unrealized capital gains. Over time, this tax benefit does add materially to the overall return due to the compounding effect. Later in our example, we will do a sensitivity analysis where we change the portion of returns coming from realized or unrealized capital gains to highlight the tax pitfalls of active trading!
Practical Note for Income Attribution: When we talk about return attribution, we are talking about the percent of returns coming from each income type. This means looking at the dollar amount of gross returns per type and dividing it by the total dollar amount of returns across the portfolio. In real life, this exercise can be done on a forward looking basis with estimates/targets of where future returns will be generated. Better yet though, one could also look back at the historical actual interest, dividends and capital gains from prior year portfolio statements and/or tax returns. This monitoring of actual historical data will show the true after-tax return and could be compared to your forward-looking forecast.
Example After-Tax Return Calculation
For our example on how to calculate after-tax returns, we will place investors in a country that charges a high tax rate for interest income at 40%, taxes dividend by 25%, and taxes realized capital gains by 20%. The portfolio will be set up for an investor looking mainly for equity market risk and long-term capital gains, but we will throw in some interest income for example sake. This means the portfolio will be aiming for a 9% pre-tax annual return from equity ownership with 1% of return coming from interest income, 2% coming from dividends, 2% from realized capital gains, and 4% from unrealized capital gains.
The below table details the calculation of what the after-tax return would look like for this example portfolio. As can be seen in the calculation, the after-tax return for this portfolio is 7.7%. The tax drag of 1.3% from the gross 9% return represents a 14.4% reduction in returns.
The Tax-Efficiency of Unrealized Capital Gains
The unrealized capital gains contributing 4% of portfolio return in our example compound untaxed and are a great benefit of long-term investing over active trading which gets taxed annually. If the investor in our example was achieving the same 9% return but with 4% coming from realized capital gains and 2% from unrealized, this would lead to an after-tax return of 7.3% which means an additional tag drag of 0.4% (4.4% of gross returns) from the initial 9% return. This decrease in after-tax returns will compound to be a more significant percentage over the long-term! If we run this change through the 30-year compounder in our free return calculator (to be discussed next), the taxable margin account sees its ending value decrease by 7.2%!
Deferred taxes on unrealized capital gains are a major reason long-term investing is the way to go. When deferred tax benefits come to mind, I often think about Berkshire Hathaway’s long-term investment in Coca-Cola. To sell and pay the capital gains tax on Berkshire Hathaway’s Coca-Cola investment would be hugely detrimental to returns as the proceeds from the sale would be taxed heavily with the after-tax amount that gets to be reinvested significantly diminished.
Compounding After-Tax Returns over a Savings Phase
Once we have calculated the after-tax return for the account, we can then compound returns into the future taking annual contributions into account. This can be calculated using the present value function on a scientific calculator, or you can get more detailed and create an annual schedule in Excel like our financial planning template provides. Investors can adjust the template to meet their tax jurisdiction needs and also plan for future unique account withdrawals for items such as a house or car purchase.
In our example over 30 years, we will be spreading $10,000 of annual savings across three accounts with $2,500 going to a taxable margin account, $5,000 to a tax-deferred 401K (RRSP up in Canada), and $2,500 to tax-free IRA (TFSA up in Canada). In this simplified example, the compounding of these contributions at the applicable pre or post-tax returns leads to a portfolio value of $1,346,717 in 30 years as can be seen below!
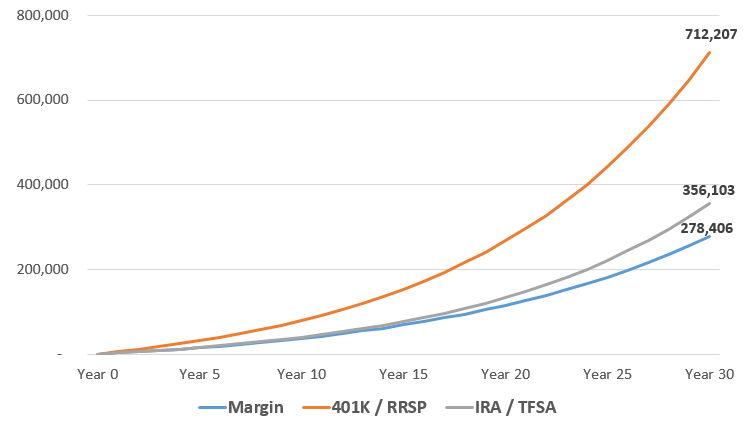
Taking advantage of tax deferred accounts should be top priority for investors as tax drag can have significant effects over time. In the above example, we can see that the taxable margin account’s ending value of $278,406 is 28% lower than the IRA/TFSA’s $356,103 ending value because the latter compounded 30 years of tax free returns!
Takeaway for Investors
The compounding effect snowballs wealth over time but taxes can have a limiting effect. Understanding the return characteristics of an asset or investing strategy will help decide which type of account the investment should be held in to minimize overall taxes. In addition to this article’s compound return calculator, IFB’s products page has more guides and products to get investors knowledgeable and excited about confidently handling their own investment decisions. Remember that incorporating after-tax return figures into your financial plan is critical and not to be overlooked.
