To see all recent Tesla (TSLA) 10q filings registered with the Securities and Exchange Commission, click this link or on the picture below.
TSLA Analysis (Recent 10-q)
The automotive industry is tough to analyze right now, with recent quarterly figures looking disastrous for U.S. leaders like Ford, and General Motors, but also for international giants like Toyota, Honda, and Volkswagen. Everyone except for Tesla ($TSLA) seems to be having a really rough go at it, and projecting what the return of “normal” demand will be for them is very difficult in these early stages.
You could argue that:
- Car parts still deteriorate even when used less, so replacement cycles could stay consistent
- Low interest rates could spurn V-shaped demand for new vehicles because of favorable financing options
- The disproportionate negative effects to lower incomes won’t move the needle for new car sales, especially premium brands like Tesla
You could also argue that:
- People are going to hold on to their cars longer due to economic uncertainty
- Bankruptcies in car rental companies like Hertz has flooded the used car market, driving down auto prices across the board
- Less driving both now and into the future of remote working means less wear and tear and a longer replacement cycle
I’m not here to argue the former points or the latter. I think the consequences of COVID-19 are much easier to quantify in other industries compared to the auto industry, especially when we are talking about the next 5-10 years.
China is the Key Right Now for Tesla
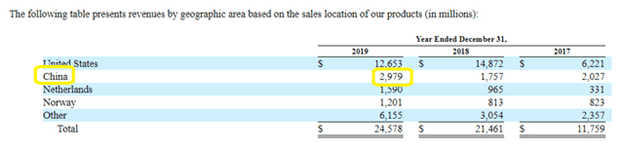
But I do think we can look at China for early indications of the type of “demand rebound” those companies are facing, which is pertinent to Tesla investors anyways, with China being the #2 country for the company in revenues.
Where the U.S. has been heavily criticized for their role in handling the COVID-19 crisis, China is looked to as the leader in the recovery– at least in the sense that they were “first-to-market” with the virus and have had a longer time to react. Of course, countries in the West including the United States have been upset with China’s handling of the crisis for other reasons, but that’s another topic altogether.
The media has been dropping hints around China’s progress with the COVID-19 recovery, as quickly observed by just a few recent headlines:
- Air Travel Within China Is Nearly at Pre-Pandemic Levels
- Coronavirus Update: China Gets Healthy, U.S. Gets Sicker And Europe ‘Wilts’
- Coronavirus: Vaccine front-runner China already inoculating workers
Whether these headlines are sensational or have truth sprinkled in, it makes a lot of sense to look at China right now.
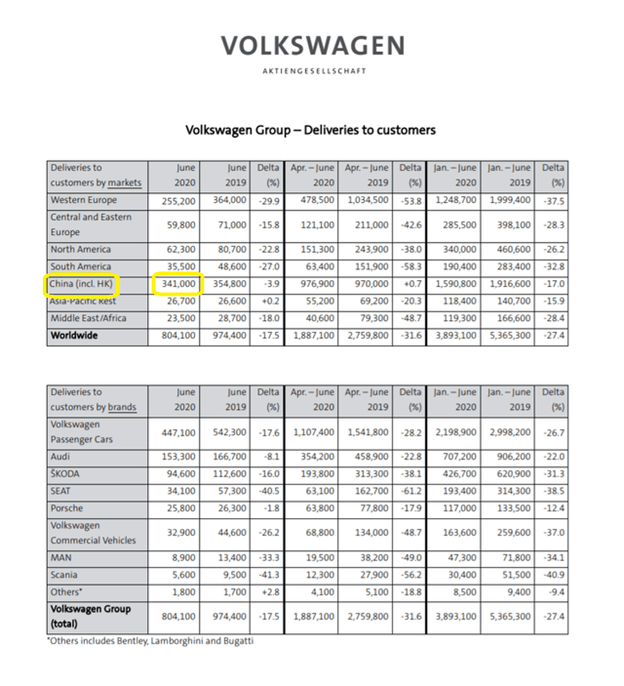
And Volkswagen Group recently released their “Deliveries to customers – July 2020 report”, which showed a strong rebound in China:
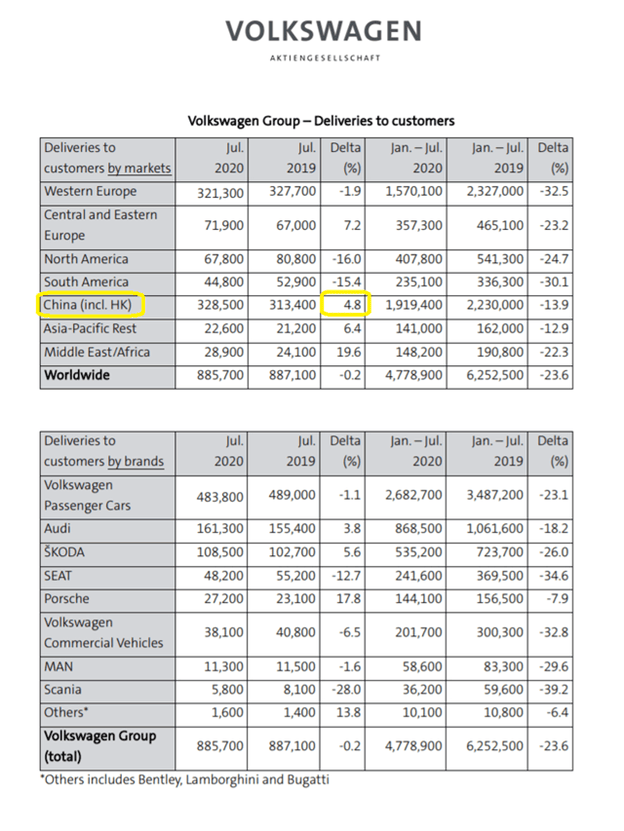
In fact, China and the rest of Asia-Pacific is only down in the low teens for the entire 1st half of the year (YOY), compared to everywhere else, where 1st half of the year (YOY) is still down at least -20% or worse. This rebound for VW was enough to push total deliveries for the China + Hong Region above Western Europe for YTD, a big shift there.
GM is another company to look at, as they’ve had decreasing market share in China over the last 3 years but have China as the country with the biggest units delivered compared to every other country.
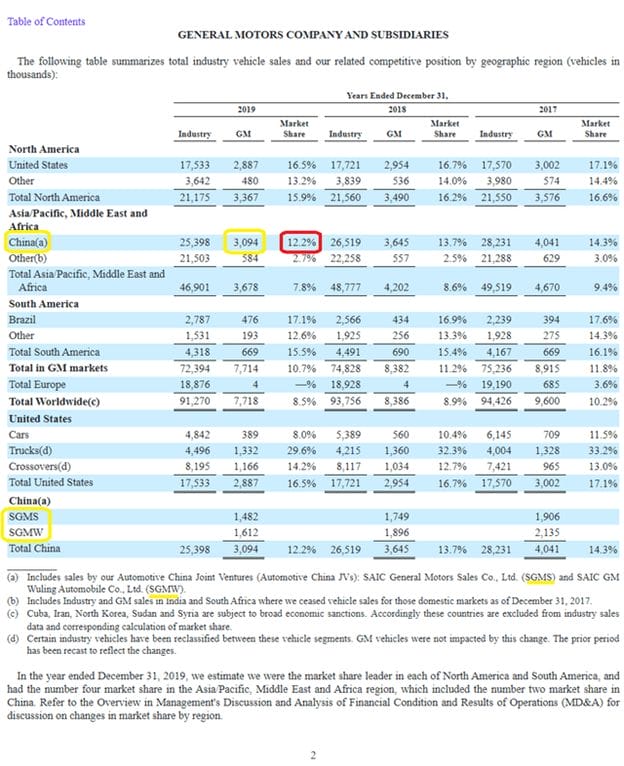
From their latest 10-q (covering up to June 30, 2020), the company reported (bolded emphasis mine):
Industry sales in China were 10.2 million units in the six months ended June 30, 2020, representing a decrease of 19.3% compared to the corresponding period in 2019. Our total vehicle sales in China were 1.2 million units for market share of 11.5% in the six months ended June 30, 2020, representing a decrease of 0.9 percentage points compared to the corresponding period in 2019. The sales across all brands decreased in the six months ended June 30, 2020, compared to the corresponding period in 2019, primarily driven by an industry downturn significantly impacted by the COVID-19 pandemic.
This is pertinent when we circle back to Tesla, who also reported earnings and a 10-q spanning the same time period, the 3 months ending June 30, 2020. They summarized the demand headwinds pertaining to COVID-19 in this way (bolded emphasis mine):
Automotive—Demand and Sales
In the second quarter of 2020, the maturity and adaptability of our business model, together with the advanced technology in our vehicles that enabled options for touchless test drives and deliveries, continued to allow us to market and deliver vehicles notwithstanding challenges impacting the automotive industry as a whole…
We also expect our international manufacturing expansion to continue to drive demand. For example, Model 3 was the best-selling electric vehicle during the second quarter of 2020 in China, where Gigafactory Shanghai allows us to offer locally-produced Model 3 vehicles with industry-leading standard equipment at a lower price point than competing mid-sized premium sedans even before the impact of government or tax incentives.
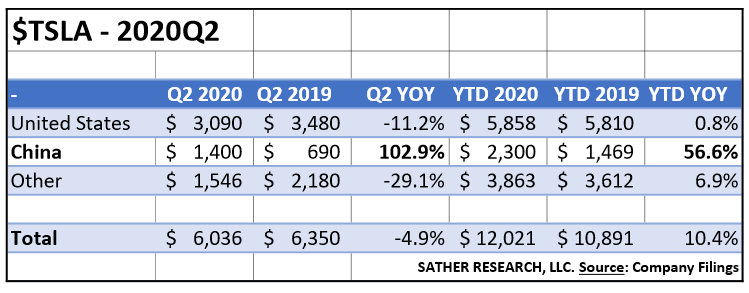
Looking at their YOY change over the quarter, we saw this breakdown:
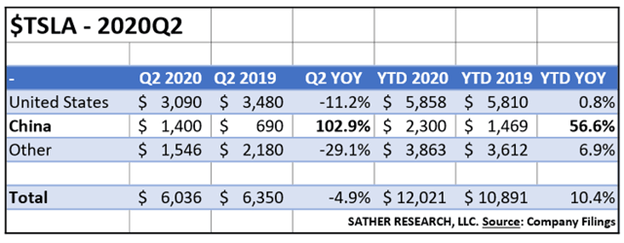
The growth in revenue in China (102.9% YOY Q2, 56.6% YOY YTD) is quite stunning especially considering the struggles that other companies that play big in that market are having, like GM.
The -4.9% YOY drop in total revenues for Q2 is also impressive, especially when compared to peers. Some examples of the kinds of revenues these peers are having to deal with lately:
- VW Group sales revenue down -23.2% YOY for the 1st half of 2020
- Honda with a -1,494.4 billion yen reduction in sales revenue for their automotive business reported for their quarter ending June 30, 2020.
- Toyota seeing a drop of -40.4% in sales revenues YOY and -98.1% in operating revenue
COVID-19 Doesn’t Care About Equality
We’re really seeing the tale of two very different plots in the automotive industry, with Tesla’s fantastic Q2 not even including the likely uptick in July, similar to what VW reported in their deliveries report.
Like with the dichotomy of technology and cloud dominance versus the faltering of travel, entertainment, and restaurants, it’s a very unequal distribution of gains and losses and there doesn’t seem to be much on the horizon to change that fact for now.
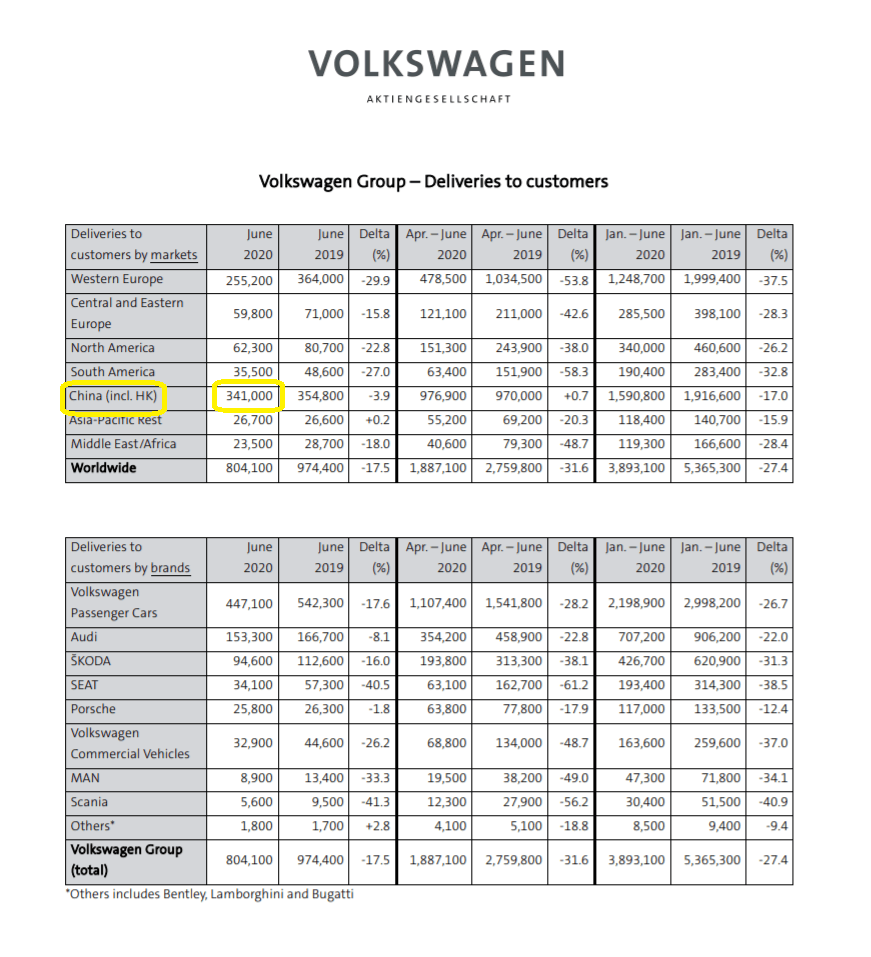
Go back to the VW deliveries, this time for June 2020:
By my back of the napkin math right there, that represents about an 8% swing in deliveries from June to July– which bodes well for a possibly strong recovery in the region for other automakers too.
For Tesla, that could mean an earnings smasher for Q3 that’s even more impressive than everything we’ve seen to date.
TSLA Analysis (October 2020 Update)
Summarizing the quarter for Volkswagen for the entire Q3 quarter, we find that the company’s total sales were down -7.6% YOY. This represented a much better improvement from the start of the pandemic, and has affected the company’s outlook depending on region in the following way:
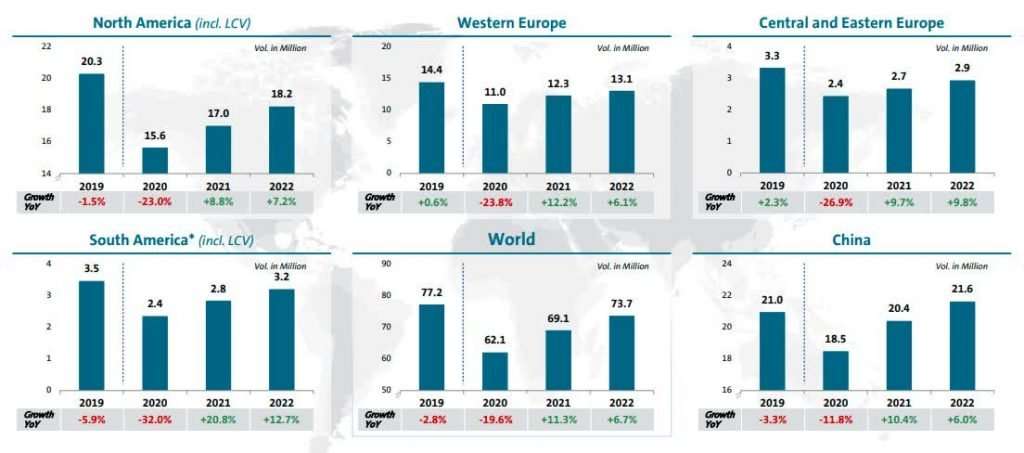
Note that the only region expected to show improvement from 2019 into 2022 would be China– while every other region is expected to grow but not surpass 2019 volume by 2022.
This was for the total passenger car market and includes (LCV) light commercial vehicles for North America and South America.
The latest guidance, outlook, and results from Volkswagen’s recent presentation provided a good glimpse for Tesla’s earnings results due out October 21st, at the market close.
The company had a good response on Wall Street immediately following the release, with several upgrades by analysts and a strong +5% day on the market. Let’s dig-in to those results which will be reflected in Tesla’s 10-q to follow (soon).
TSLA Q3 2020 Results
First, a short summary of some of the company’s financial highlights:
- +39% YOY growth in revenue
- “Substantial” growth in vehicle deliveries
- Average selling price (ASP) slightly lower
- 9.2% operating margin
- $809 million in operating income (which is a record)
- Note that this was on top of a significant amount of stock based compensation expense to the CEO (to the tune of $290 million)—the “2018 CEO Award”
- Cash and cash equivalents increased to $14.5 billion
- Boosted by $5.0B equity offering
Noting some key operating metrics reveals how the company has been doing recently (and through the pandemic) on both the ramp up production side and delivery side.
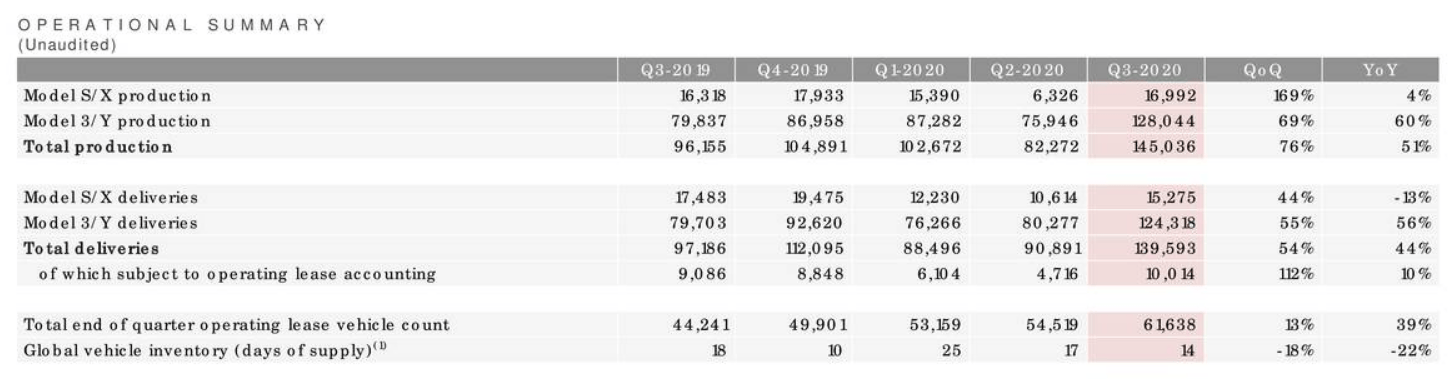
Annual capacities should also be noted, as high production compared to capacity should indicate both high demand and acceptable execution for the plants. According to the company’s slides:
- Fremont
- Model S/X Capacity = 90,000
- Model 3/Y Capacity = 500,000
- Shanghai, China
- Model 3 Capacity = 250,000
The following plants are also either in development or under construction for models currently being produced but also for future hyped lines such as the Cybertruck, Tesla Semi, and Roadster:
- Shanghai, China (1)
- Berlin, Germany (2)
- Texas, US (2)
- United States (2)
To get management’s comments on recent progress, we can also turn to the Q3 transcript. First, on costs for the Model Y in which development is in progress (in China):
Zachary Kirkhorn
Shanghai continues to make good progress there. Model Y cost is also coming down quite quickly as we ramp that. But we’ve guided in the past that Model Y cost should be roughly equivalent to the Model 3 built in Fremont costs. It’s not quite there, and it’s also a bit of a moving target as Model 3 Fremont cost comes down, Model Y also has to come down with that. But we’re generally seeing strength in Shanghai margin strength in Model Y margins. And not too far off of this, we’re seeing strength in Model 3 Fremont and S and X margins. So overall, for the quarter, I think it was quite a good story for the products.
TSLA Financials and Valuation
For the earnings call and accompanying slides for the earnings presentation, there was no indication of the split in revenues between China and the rest of the company’s geographies, but this will be displayed in the upcoming 10-q to be filed for the quarter.
However, it’s not hard to imagine that the strong Q2 progress should carry over into Q3, especially considering the production numbers coming out about the country of China as a whole, as well as the results recently released by Volkswagen and can be continued to be monitored through the company’s investor relations page.
For valuation purposes, I will simply take the operating income per share and run a reverse DCF model to find out how much growth Wall Street is pricing in based on how the stock price is at today.
Please note that I will not make an opinion one way or the other on the valuation results and whether they would be achieved. This is just a simple formula (the DCF model) taught for the CFA and in business schools that tends to be heavily utilized on a majority of the companies trading on Wall Street. However, as we all know, Tesla is anything but the average company—but it should be insightful to see what the model says anyways.
For the discount rate, I will be using 6%. This is consistent with the discount rates I’ve been using for reverse DCFs on other companies in some of my research (though I won’t necessarily recommend stocks based off this).
The 6% discount rate is just reflective of the very low interest rate environment that we’re all faced with today, which pushes down the cost of capital. You could argue that Tesla with a current WACC of 12%+ deserves a higher discount rate, but with historical annual WACCs at around 6% and its ability to raise capital fairly easily (evidenced by the latest equity offering), I think many analysts are plugging in a discount rate of close to 6% in their models.
Operating income per share will be used for this exercise instead of the traditional free cash flow since most of that is being plowed back into the business in capital expenditures to develop the plants mentioned above.
My estimate for Operating income (or cash flow from operating activities) per share is the following:
- TTM CFFO / Share = (Q3 2020 – Q4 2019 CFFO) / Diluted Shares Outstanding (Q3 2020)
- TTM CFFO / Share = ($2,400 +$964 -$440 +$1,425) / 1,105
- TTM CFFO / Share = $3.94
Implied growth = 29.85%
Obviously that implied growth rate is very high. However, keep in mind that the YOY increase in revenue for the company in Q3 2020 was +39%. Also, keep in mind that the reverse DCF model above assumes a 29.85% growth in CFFO which turns to free cash flow (FCF) on a $1-to-$1 basis, and achieves the 29.85% growth over 10 years.
Finally, please remember that this is not a recommendation to buy or sell TSLA stock. I’m simply presenting analysis based on publicly available information, to try and understand what’s going on the business and why is it being priced like it is.
For more in-depth company tear downs like this, consider following my profile, where I make guest contributions, on Seeking Alpha.
