Dividends are one of the best ways companies can return value to shareholders. Share buybacks have become all the rage in the investing world, pushing dividends to the back burner. But this underappreciated method of investing creates wealth over time like no other with the power of compounding.
I thought with this post; I would create a little book of big dividends to give you a one-stop-shop to find out everything you might need or want to know about dividends.
Not all companies pay dividends, and they have their reasons for doing so, but many regard companies as shareholder-friendly. Even though Warren Buffett doesn’t pay a dividend with Berkshire Hathaway, he invests in companies that pay dividends.
Buffett understands the power of compounding and how dividends can grow the wealth of both shareholders and companies. Buffett has shown over the years that he can compound Berkshire’s money at rates that are difficult to replicate elsewhere and has arguably earned the right not to pay a dividend. But that is an argument for a later day.
Items we will learn today:
- What Are Dividends?
- Dividend Metrics That Matter
- The Impact of Compounding and Dripping
- The Best Dividend Paying Stocks
Ok, let’s dive in.
What Are Dividends?
Dividends are payments made by a company to the shareholders or individuals who have purchased company shares. Any owner of the company’s stock, individual or fund, remains eligible to receive dividends from the company.
Not all companies pay dividends; some of that will depend on where they are in their life cycle. Typically young companies will not pay a dividend; rather, they will reinvest any cash flow into the business to grow the company.
Examples of this might include Amazon, Google, Facebook, and Netflix. These companies continue to grow at all costs and use any extra money to grow the company. Our discussion today will not delve into the right or wrong of this idea but how we can benefit from the companies that pay dividends.
Companies typically pay dividends quarterly or every three months. But some also pay them semi-annually, like Disney. Or they can pay them every month or once a year. It will depend on each company and its business’s cash flow.
How do Dividends Work?
Dividends are cash the company pays you for owning shares of the company. Typically, the money transfers directly to your brokerage account whenever they pay the dividend. However, we can also reinvest back into the company through a process known as DRIP, more on this in a moment.
Companies must declare dividends through the board of directors each time the company pays a dividend. When the company announces a dividend, it will announce how much it will pay, when it will pay the dividend, and the ex-dividend date occurs.
What is the ex-dividend date?
Well, the ex-dividend indicates the investor who wants to receive the dividend payment must be a shareholder of record on or before the date—keeping in mind ownership doesn’t always happen immediately when you purchase a company through your brokerage. That means the ex-dividend date remains important to note if you want to consider becoming a shareholder.
Dividends come from a company’s cash flow, with the actual amount distributed available for all to see on the cash flow statement of any public company; you can find it on any 10Q or 10K report. Every year the board of directors will indicate how much a company can pay out as dividends. Then it is up to the CEO and other managers to inform the board they would like to distribute a dividend declaring a dividend.
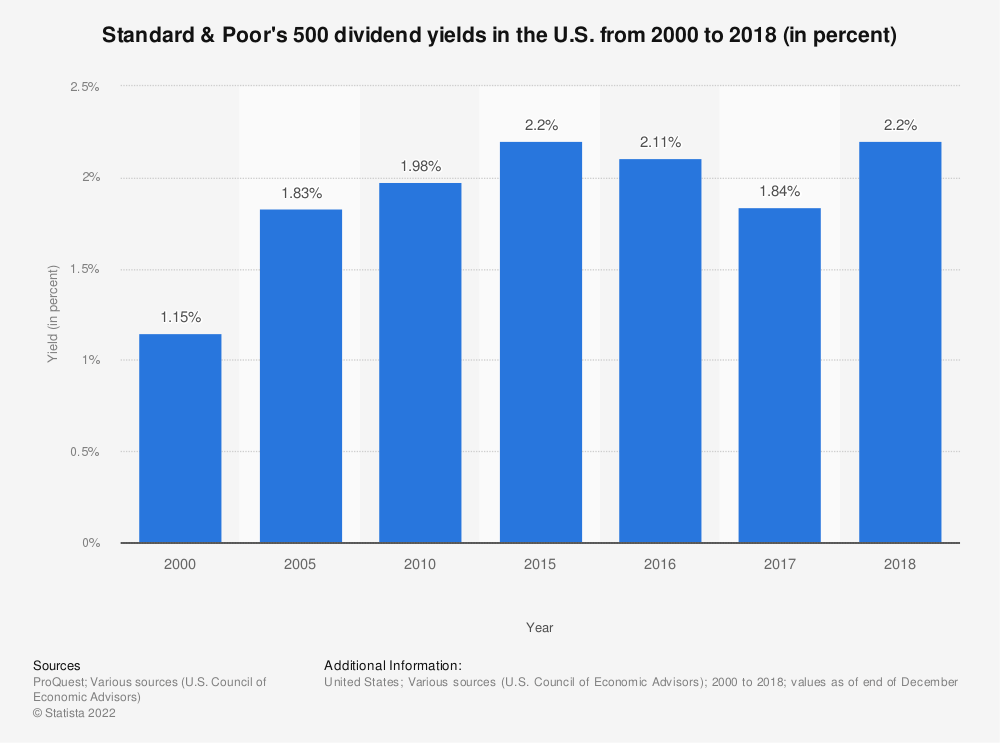
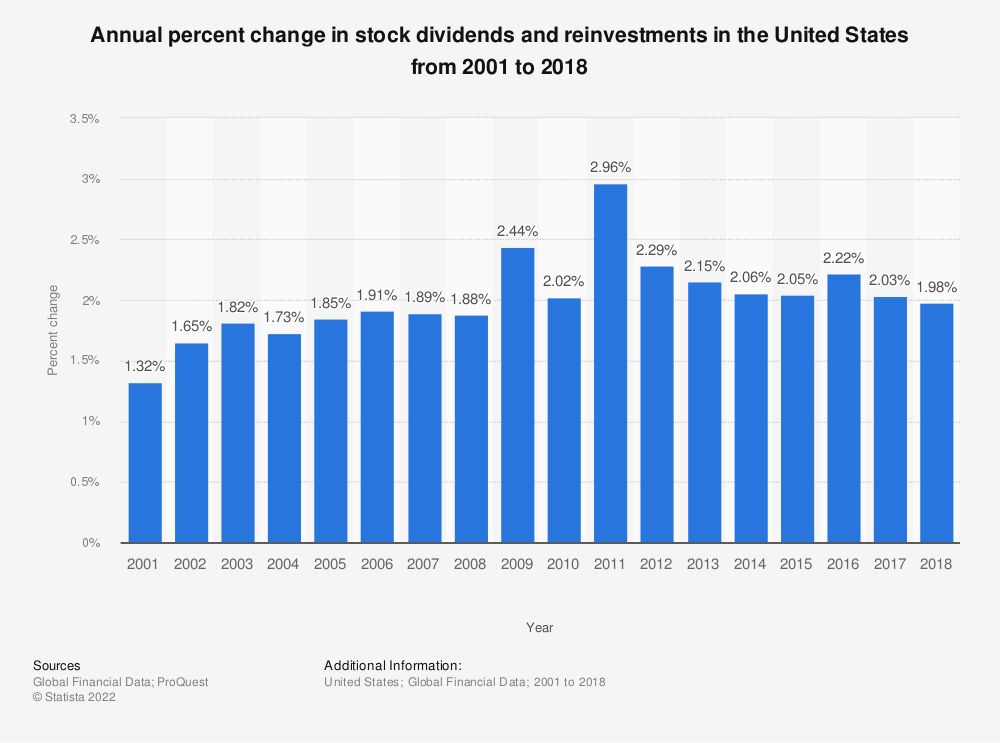
How can dividends impact an investment? Certainly, this will vary, but let’s look at the impact it has had on the returns of the S&P 500 as a reference.
Over the 90 years between 1871 and 1960, the dividend yield for the S&P 500 never fell below 3%, with the period from 1960 to 1990, there were only five years the yield fell below 3%. Since the 1990s, companies have moved away from dividends towards share repurchases to return value to shareholders.
Some of this change reflects in the low-interest rates that have permeated the markets since 1987 and Alan Greenspan and the rise of internet-based companies, which are typically growth players and not interested in dividends.
The S&P 500 has returned between 10 to 11 percent returns from 1878 to 2019, with around 2.5 and 3 percent of those returns, including dividends.
Let’s put some numbers to that to give you some perspective.
If you invested $10,000 in the market for 90 years with a return of 10 percent, you would receive $53 million-plus; likewise, if you invested the same amount with a return of 7 percent, you would receive $4.4 million for the same time.
That is the impact that dividends can have on our portfolio, and it is pretty impactful.
Ok, let’s look next at how we measure dividends.
Dividend Metrics that Matter
Four main metrics are in use to measure dividends. Using the metrics allows us to measure the company’s performance against its peers. And it gives us a better sense of the company’s dividend performance.
Dividends Per Share
The definition of dividend per share according to Investopedia:
“Dividend per share (DPS) is the sum of declared dividends issued by a company for every ordinary share outstanding. The figure is calculated by dividing the total dividends paid out by a business, including interim dividends, over a period of time by the number of outstanding ordinary shares issued.”
The dividend per share metric is important to shareholders because this metric tells us how much cash we receive for each share of the company we own. It is also the most straightforward way to indicate how much money a shareholder will receive over time, regardless of the stock’s price fluctuations.
Growing the dividend is also an important consideration over time because it tells us how likely the continuation of the growth will continue.
Calculating dividends per share is straightforward; we take numbers from the income statement in shares outstanding and use them to divide by the dividends paid out that we can gather from the cash flow statement.
Dividends Per Share = Dividends Paid / Shares Outstanding
Let’s use a dividend aristocrat to calculate the dividends per share formula. How about Coca-Cola (KO), one of the oldest in the ranks of dividend aristocrats?
I will look up both financial statements from the latest annual report or 10-k and highlight the needed numbers. All numbers, unless otherwise stated, will be in the millions for reference.
Pulling the numbers from the financials:
- Dividends paid out = $7,252
- Shares Outstanding – 4,325
Now, we can plug the above numbers into our formula to find the dividends per share.
Divedends per Share = $7,252 / 4325
Dividends per Share = $1.68
Coke is a member of a group called the Dividend Aristocrats, more on them in a moment. Coke has paid a dividend since 1920 and has increased its dividend yearly since 1996.
You can quite easily pull this number from your favorite financial website, but since it is so easy and it is always best to go to the source documents, I encourage you to take a few extra minutes to do this yourself.
The above number is the amount Coke will pay you each year for each share of the company you own, but since Coke pays the dividend quarterly, you would divide it by four to determine how much you would receive each quarter.
$1.68 / 4 = $0.42 per quarter
We are moving on to the next metric in our dividend arsenal.
Dividend Yield
We can find the dividend yield expressed as a ratio of the dividend per share divided by the current market price. The Ratio tells us how much the company pays out each year, and since it connects to the market price of a company will fluctuate daily.
The benefit of using a dividend yield gives us the ability to compare the yield to other companies. Using a metric like per share doesn’t offer the best comparison because every company that pays a dividend is in a different position financially, and some more mature companies can pay out more of their cash flow in dividends than younger companies.
Companies in the utility and consumer staple sectors typically have larger dividend yields, as do REITs ( Real Estate Investment Trusts), and operate under different covenants regarding their financial distributions. Also, financial companies such as banks and insurance companies pay higher-paying yields.
Companies such as REITs, MLPs (master limited partnerships), and BDCs (business development companies) pay higher yields, but they are also required to tax the dividends at a higher rate.
Using Coke as our example, let’s calculate a yield; we can take our calculated dividend per share of $1.68 and compare it to the current market price of $54.98.
Dividend Yield = Dividend per Share / Current Market Price
Dividend Yield = $1.68 / $54.98
Dividend Yield = 3.05%
You could also use the current trailing twelve-month dividend per share, which is $1.61, and compare it to the current market price, which gives us a yield of 2.92%.
As you probably noticed, yield and stock price are inversely related. As the price goes down, the yield will rise, and vice-versa.
There are two ways to raise a dividend yield for a company, and they are:
- Raise the dividend of the company
- A falling stock price with the dividend remaining the same will raise the yield.
One thing to always keep in mind regarding dividend yield, a rising dividend yield does not always indicate a great investment because, in many cases, it is related to a sharply falling price.
Anytime you see a high dividend yield, typically above 4%, it should indicate additional research to determine the cause of the higher yield, especially in businesses who usually don’t pay out such high yields.
In the middle of a quarter, it is a good idea to look at the last known dividend and multiply by four, then divide the yearly dividend by the current market price to get the most current yield for any analysis you are doing.
Remember that the dividend yield tells us how much return we will receive for investing in the company in regards to the company’s dividend, regardless of how the share price fluctuates.
Ok, let’s move on to the next dividend metric.
Payout Ratio
One of the quickest ways to determine the safety of dividend payout is to look at the payout ratio.
The dividend payout ratio is the amount of dividends paid out in relation to a company’s earnings or net income. We can express the ratio as a percentage of earnings paid out in dividends. The number of leftovers can help pay down debt or reinvest into the company.
The dividend payout ratio tells us how much money the company is paying out to investors in relation to how much it keeps for operations of the business or paying down debt, or adding to retained earnings (cash reserves).
Several things we must consider when looking at the dividend payout ratio. First, a younger company focused on growth will either pay no dividend or a limited dividend. Rather those companies will use all of their funds to grow the company and may be excused for not paying a dividend at that time.
Whereas a more mature company will typically pay out a larger portion of its earnings as dividends to reward shareholders for owning the company or to compensate for the lack of growth in the company.
The formula for calculating the dividend payout ratio:
Dividend Payout Ratio = Dividends Per Share / Earnings Per Share
Going back to the financial documents, we will pull numbers from the income and cash flow statements from the latest 10q for Coke.
- Earnings per share – 0.44
- Dividends paid out – $1,904
- Shares outstanding – 4331
Next, we will calculate our dividends per share;
Dividends Per Share = 1904 / 4331
Dividends Per Share = $0.44
Now we can calculate our payout ratio.
Dividend Payout Ratio = 0.44 / 0.44
Dividend Payout Ratio = 100%
Now, that simple process tells us that Coke pays out 100% of its earnings as dividends each quarter, which will fluctuate as the earnings per share fluctuates, or the dividends per share fluctuates.
One of the easiest ways to determine the safety of the dividend continuing is by calculating the dividend payout ratio. Typically the lower the number, the safer the number, but again we have to consider both the industry the company resides and wherein the company occupies the lifecycle.
If you see a payout ratio above 100%, that is a sign of concern because that is unsustainable as it is paying out more than the company is earning. Always investigate if you discover a payout ratio higher than is normal or exceedingly high. There might be a situation where a company is paying out a special dividend from extra income, which can drive the payout ratio higher, as would the dividend yield.
Growth Rate of Dividends
Another useful metric for determining the strength of a continuing dividend is the growth rate. The growth rate is determined by annualizing the growth rate of the dividend over some time, such as five years.
Many mature companies such as AT&T, Johnson & Johnson, Coke, and others seek to grow their dividends over time. Any company that exhibits strong dividend growth indicates that dividend growth is likely to continue, but it also signals the company’s long-term profitability.
The growth rate is also used in the dividend discount model to calculate the company’s intrinsic value.
We can calculate a company’s dividend growth by taking an average of the growth over time. In our case, we will look at the growth of AT&T’s dividend over five years and determine the growth rate.
The dividend payouts of AT&T over the last five years, including the TTM:
- 2018 – $2.01
- 2019 – $ 2.05
- 2020 – $2.08
- 2021 – $2.08
- TTM – $1.60
To calculate the growth, we use the following formula:
Dividend Growth = Dividend(YearX) / Dividend(Year(x-1) – 1
In the above example from AT&T, the yearly growth rates are:
- 2018 Growth Rate = NA
- 2019 Growth Rate = $2.05 / $2.01 – 1 = 2.02%
- 2020 Growth Rate = $2.08 / $2.05 – 1 = 1.03%
- 2021 Growth Rate = $2.08 / $2.08 = 0%
- TTM Growth Rate = $1.60-2.08 / 1 = (0.48)%
Now we add all the growth rates and take an average of them to find our growth rate.
AT&T Growth Rate = (2.02 + 1.06 + 0 + (0.48)) / 4
AT&T Growth Rate = 0.65%
Compare that to the five-year growth of the closest competitor, Verizon, which has a 2.4% growth rate of its dividend.
Calculating the growth rate of the dividends is important as a means of comparison to others in the same sector, as you can determine the company’s financial strength and its competitors. Plus, it helps determine the likelihood of a continuation of the dividend and what kind of growth you can expect from the company in the future.
Dividends Plus Buybacks
With the increase in share repurchases to return value to investors, it is a good idea to consider those returns in conjunction with dividends.
Many of the same metrics we use, such as dividends per share, we can calculate using the amount of money a company uses to repurchase shares.
Let’s consider a company like McDonald’s with a strong history of dividend payouts and a rising dividend but also a strong history of share repurchases.
If we look at the dividends + repurchases per share, we can see how much the company returns to its shareholders via both ideas.
I am pulling the above line items from the cash flow statement for McDonald’s from the latest 10k December 2021.
- Shares Outstanding – 752
- Dividends Paid – $3,918
- Share Repurchases – $846
We can calculate our dividends per share and buybacks per share.
Dividends And Repurchases Per Share = (3,918 + 846 ) / 752
Dividends and Repurchases Per Share = $6.33
That tells us how much the company returned to shareholders for each share they own, but another aspect of this looks at the yield of the above metric to determine how sustainable it remains.
Earnings per share for McDonald’s for the past year equals $10.04 per share, and the current market price is $243; when we calculate our yield, we find a yield equaling 2.16%, and the payout ratio of 52.2%
The yield is fantastic, and the payout ratio works too.
I used McDonald’s to illustrate the effect share repurchases can have on our investments and also an illustration to check the yield and payout ratio quickly as a check.
Okay, now that we understand some of the metrics concerning dividends, let’s look at the effect dividends can have on our investment returns.
The Impact of Compounding and Dripping Your Dividends
A visualization to explain how dividend investing can grow your wealth.
Imagine a snowball on the top of a hill; as the snowball begins to roll down, it picks up speed and starts to grow as more and more snow is added to the snowball. By the time the snowball reaches the bottom of the hill, it is at top speed but has also grown in size, which helps increase the speed, and on and on it goes.
The above example illustrates how compounding works and how investing with dividends can help grow wealth.
Think about the famous line about compounding and its power from Albert Einstein:
“The most powerful force in the world is compounding interest.”
Another illustration of the power of compounding is thinking about investing $1 a day with 1% compounded daily. In five years, your $1 would be worth $77 million, and by the seventh year, you would be the richest man in the world.
Pretty powerful stuff.
Remember, compounding doesn’t represent a get-rich-quick scheme; rather, a continuous grinding building of your wealth slowly like the snowball rolling down the hill.
Now, what does all this have to do with dividends?
Buying companies who pay a growing dividend over time will grow your wealth because of the effect of compounding. Using the metrics above, we can find companies paying strong, growing dividends which will likely continue for years into the future.
Using those metrics helps you find companies that will help grow your wealth; otherwise, you only rely on the company’s price appreciation.
In addition to the power of compounding, we need to examine the power of DRIPs.
As we mentioned earlier, DRIPs are known as Dividend Reinvestment Programs, and you can either do this directly with a company such as Coke or elect to have your brokerage handle the DRIP for you.
In essence, a DRIP is taking the cash you get from your investment in the company from a dividend and then using the cash to buy a fractional share of the company. For example, your brokerage will take the cash when Coke issues its quarterly dividend and buy a fraction of the share.
The quarterly dividend for Coke is currently $0.42. Let’s say you own one share of Coke when the company issues its dividend instead of cash going directly into your brokerage account. The brokerage instead will purchase a portion of the share of Coke, currently priced at $54, which means for each dividend per share, we would get a portion of Coke that equals $0.008, or rounding equals $.01.
Now I know you are saying, Dave, what’s the big deal with one cent? Well, that one cent now adds to your investment in Coke, meaning the company is now worth $54.01, and you would get a greater portion of dividends on the next payment. As those dividends grow, so does your total investment, which continually compounds as both the dividend and your total investment grow, so it is a double compounding effect.
For more details on the power of DRIP Investing, please look below:
7 Reasons to Prioritize DRIP Investing in Your Portfolio
And for more on the power of compounding, below:
10 Reasons Why Compounding Interest is the 8th Wonder of the World
And now, let’s dive and discover some options for finding great dividend-paying companies.
Best Dividend Paying Stocks
When considering adding dividned paying companies to your portfolio, we have several options to consider. Among them are the types of companies you are considering, such as growth, the kinds of industry you are considering, and your investment goals.

When investing in dividend companies, all the same rules apply when analyzing any company. We want to find strong companies with a fair price and any other requirements you consider part of your investment checklist.
The first place is to consider companies growing their dividends over time. We can define two aspects, profitable companies likely to continue paying the dividend and companies continuing to grow their profits to allow them to continue paying dividends.
Luckily there are a few lists to consider when looking for companies with those kinds of track records.
The first is Dividend Kings, which refers to companies paying a growing annual dividend for over 50 years! The companies are all listed on the S&P 500, and currently, 29 companies fit the description.
Among them are Coca-Cola (KO), Hormel (HRL), Johnson & Johnson (JNJ), and many more. The company paying the longest-growing dividend with 65 years is American States Water (AWR).
The second list, probably more familiar to those who have been investing for a little longer, is the Dividend Aristocrats, which comprises of the Dividend Kings, along with new companies in the S&P 500 and have paid a growing annual dividend for 25 years or more.
The Dividend Aristocrats include up to 66 companies, with the newest additions being Realty Income (O), Amcor (AMCR), and Ross Stores (ROST), among many others.
Using the Kings and Aristocrats as starting points to find a strong, dividend-paying company is a great place to start to find great investments that will grow your wealth.
Additional lists you can cull are for Dividend Contenders, who have paid a growing dividend for ten to years, or the Dividend Challengers, who have paid a growing dividend for five to nine years.
You can find lists of all the above companies to begin your research below:
DRIP Investing Resource Center
As with any aspect of investing, doing your due diligence remains critical; never buy a company just because they pay a dividend for 65 years; you need to find the right price. If you like a particular company, but remain too expensive, then put the company on your wish list and be patient.
Final Thoughts
Buying a company paying a growing dividend remains the holy grail for most investors, myself included. Not all dividend-paying companies are great investments; some are languishing and solely exist to pay a dividend and offer the only “growth” you will get from the company.
Any company beginning to pay a dividend will unlikely stop because everyone knows Wall Street HATES it when a company stops or cuts a dividend. Once that happens, you can automatically price in a huge price drop that will likely take years, if not decades, to recover.
Dividend investing is one of the best ways to grow your wealth over time, with the power of compounding and utilizing DRIPs. Dividend companies are typically more stable and secure and have growing profitability, making them attractive possibilities. Consider adding dividend-paying stocks to the portfolio; your future self will thank you.
That will wrap up our discussion for today; as always, thank you for taking the time to read this post.
I hope you find something of value for your investing journey.
Until next time.
Take care and be safe out there,
Dave
