Banks take the lead in earnings season every session, and analysts make a lot out of the bank’s ability to withstand losses if the economy is in a bad spot. A topic that comes up around that time is the Tier 1 Capital Ratio to assess a bank’s financial strength.
What do we truly know about the strength of a bank’s balance sheet? We can assess the strength via metrics such as debt to equity, debt to assets, etc. But using the Tier 1 capital ratio is a quick way to judge your concern about a bank’s ability to withstand any issues.
After the financial meltdown in 2007, the FDIC decided they needed to find a way to increase a bank’s capital requirements that would provide a measure of safety in the event of an event similar to 2007.
One of the outgrowths of that decision became known as Tier 1 capital ratio, with a few amendments created along the way, but as of today, we can easily determine the strength of said bank’s balance sheet.
Some of the information we will discuss today contains “inside baseball” ideas and is not for beginners, per se. If you are new to investing in banks, I suggest you check the post below first.
Bank Stocks Analysis: Understanding Basic Metrics and the Banking Industry
In today’s post, we will learn:
- What is Tier 1 Capital?
- Tier 1 Capital Components
- Relationship Between Tier 1 Capital and Stress Tests
- Tier 1 Capital Ratio Formula
- Tier 1 Capital Ratio Stats for the Banking Industry
Okay, let’s dive in and discover more about the Tier 1 capital ratio.
What is Tier 1 Capital?
Tier 1 capital as described by Investopedia:
“Tier 1 capital is used to describe the capital adequacy of a bank and refers to core capital that includes equity capital and disclosed reserves. Equity capital is inclusive of instruments that cannot be redeemed at the option of the holder.”

Tier 1 Capital gives us the best example of the bank’s capital in English. What is the bank’s capital? Bank capital equals the money stored to keep the bank going through risky transactions, such as investing, lending, or trading.
In 2013, bank regulators approved the Basel III, or Basel Accord, to better respond to deficiencies in financial regulations exposing for all to see in 2007 and 2008.
The Basel Accord determined that each bank must always hold a certain level of Tier 1 capital. Tier 1 capital ratio measures the level, which we will discuss soon.
As we mentioned above, Tier 1 concerns itself with the bank’s core capital; this mainly refers to the bank’s disclosed reserves and common stock and non-redeemable non-cumulative preferred stock available for calculating the Tier 1 capital ratio.
Tier 1 differs from Tier 2, also created with the Basel Accord. Tier 2 capital includes additional capital, such as loan loss, revaluation reserves, and undisclosed reserves. Tier 2 capital is considered less reliable, and considering those numbers is best used separately when evaluating the riskiness of the bank.
Regulators use Tier 1 capital to get banks to increase capital buffers before becoming insolvent.
The crisis of 2007 highlighted the fact that too many banks had too little capital to remain liquid or absorb losses. The bottom line: too many banks funded themselves with too much debt and not enough equity, which led to instability.
So what happens if a bank falls below the minimum levels required by Tier 1 capital?
If the bank falls below that level, it must build its capital back to the required level, or it will be overtaken by regulators or shut down.
In the event of a capital rebuild, the bank cannot distribute dividends, share repurchases, or pay employee bonuses. If the bank is insolvent, then the procession of investors to receive any return on investments is the same as any shareholders, bonds, preferred shares, and common shares.
Okay, now that we understand what Tier 1 capital is and how it works, let’s find out what constitutes a bank’s core capital.
Tier 1 Capital Components
Tier 1 capital is made up of shareholders’ equity and retained earnings. Part 324 of the Basel Accord determines Tier 1 capital consists of common equity Tier 1 capital and additional Tier 1 capital.
What is the common equity Tier 1 capital?
Common equity Tier 1 capital is the most loss-absorbing form of capital; the capital includes common stock, a surplus of treasury stock, retained earnings, and certain accumulated other comprehensive income (AOCI).
I apologize, but there will be no way around acronyms, as we are dealing with government agencies creating these rules.
The Central Bank created many rules and regulations around the AOCI as the rules relate to bond portfolio appreciation, and depreciation could significantly impact Tier 1 capital; if you want to learn more, please follow the link to the FDIC regulations on Tier 1 capital.
As pertains to our discussion, there are requirements for certain deductions from the common equity Tier 1, such as goodwill, deferred tax assets, other intangible assets, gains on sales of securities, and other investments in another bank’s capital.
Banks also must make deductions based on additional specific assets such as:
- Mortgage servicing assets
- Deferred tax assets tied to certain timing differences
- Significant investments in other bank’s common stock
Okay, so how does all that gobbly goop relate to the bank’s capital structure, and how is it measured?
The Basel III Accord we mentioned earlier established minimums that each bank must be above; for example, the minimum capital required to maintain is 10.5 percent, of which 9 percent must be common equity Tier 1. It also maintains that the Tier One capital ratio must contain at least 6 percent of CET1 (common equity Tier 1).
According to the Basel Accord, a bank’s risk-weighted assets will include all assets systemically weighted, which the bank holds for credit risk.
Central banks hold the responsibility of determining the weighting scale for different asset classes, for example:
- Cash and government securities carry zero risks unless you are in Argentina!
- Mortgage or car loans carry more risk.
The risk-weighted assets assign an increased weighting based on the asset’s credit risk; the weighting would be on a gradual scale.
For example, cash carries 0 percent weight, and loans on a rising level of riskiness would carry weights of 20%, 50%, or 100%.
Tier 1 capital differs slightly from common equity Tier 1; Tier 1 capital includes the bank’s equity, disclosed reserves, and preferred stock. CET1 excludes any preferred or minority interests and consists of common stock, retained earnings, and AOCI.
Before discussing the measurement of Tier 1 capital, let’s take a small detour.
Relationship Between Tier 1 Capital and Stress Tests
The Central Bank put bank stress tests in place after the financial crisis of 2007 to 2009. The ensuing Great Recession left many banks in tatters. The crisis revealed the level of undercapitalization and the vulnerability to any economic distress.

These observations resulted in more regulations regarding higher capital requirements, more equity, and less debt. The regulations required more reporting on the capital levels and for banks to regularly determine their solvency and report on those findings.
A bank’s stress test is an analysis to determine the capital levels required of banks to survive various economic downturns. The determinations are based on computer simulations and have varying degrees of intensity.
Any bank with a minimum of $50 billion in assets must proceed with a stress test quarterly. The stress tests cover many areas of banks, such as credit risk, market risk, and liquidity risk.
Examples of scenarios enacted in the stress tests include a Caribbean hurricane and historical events such as the Great Depression.
Banks use nine quarters of projected financials to determine if they have enough capital to survive the scenarios.
Tier 1 capital contains the main ingredient of these stress tests; the regulators must attempt to determine whether the bank has enough equity to survive an economic disaster.
When a bank fails a stress test, it takes center stage. Recently Santander and Deutsche Bank have stumbled and in the case of Deutsche, several times. No one wants to hear their bank has struggles.
With all of its trials and tribulations of recent years, Wells Fargo has spent considerable effort to maintain its Tier 1 capital to a satisfactory level and ensure that investors see the bank as strong and stable.
The regulators put Wells Fargo through the paces every year and have put additional restrictions on the bank, such as limiting or capping the asset level the bank is allowed to maintain.
Again, a major component of measuring a bank’s capital strength is the Tier 1 capital and CET1.
Okay, let’s move on to the Tier 1 capital ratio.
Tier 1 Capital Ratio Formula
The formula for calculating the Tier 1 capital ratio is simple:
Tier 1 Capital Ratio = ( Core Capital / Risk Weighted Assets ) x 100
Let’s use an easy example to illustrate this before looking at some real-life examples.
Let’s assume our bank, Sather Capital, holds $2 million in core capital and lent out $20 million to Ahern Limited. The loan comes with a risk-weighting of 80%. Now, let’s calculate the Tier 1 capital ratio.
Tier 1 Capital Ratio = ( $2,000,000 / ($20,000,000 x 80%)) x 100
Tier 1 Capital Ratio = 12.5 percent
Okay, that’s pretty simple; why don’t we try an example from a real-life bank?
The first example I would like to analyze is Wells Fargo (WFC). To find the information we need to calculate the ratio, we look in the annual or quarterly report for the Common Equity Tier 1 or Tier 1 Capital using the Control F search function, as the information we need to calculate the ratio is not listed on the balance sheet as a specific line item.
Wells Fargo does a great job of laying out the ratios and the components making up the calculations.
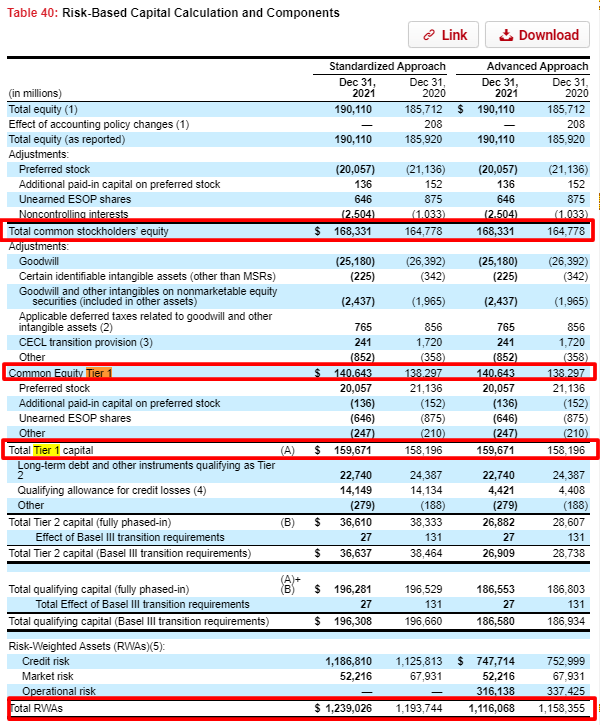
So if we first calculate the CET1 or common equity Tier 1, we get the following:
CET1 ratio = ($140,643 / $1,239,026) x 100= 11.35 percent
If you take a look at the Tier 1 capital ratio, we get the following:
Tier 1 Capital Ratio = ($159,671 / $1,239,026) x 100 = 12.88 percent
Pretty easy, huh?
And notice that Wells Fargo was well above both minimum requirements of 9 percent for CET1 and 10.5 percent for Tier 1 capital ratio, with the CET1 at 11.35 percent and Tier 1 capital ratio at 12.88 percent.
Again, Wells Fargo does a fantastic job of breaking down all the calculations to arrive at the common equity Tier 1 and Tier 1 capital. I am sure that is an attempt to be as transparent as possible, given its recent struggles with truthfulness.
To get more flavor of the breakdown by Wells Fargo, please check out the Capital Management section of its latest quarterly report.
If we look at another bank and search for the data in the Capital Management section of the quarterly report on June 30, 2022, we find that Fifth Third Bank has the following ratios:
- CET1 – 8.95%
- Tier 1 Risk-based capital – 10.23%
If you take the time to look at Tier 1 for each and any bank, you will find different levels of disclosure regarding this ratio. Many banks have no issue with capital requirements and won’t make a big deal about the levels.
As you can see, all banks will provide you with all the information to calculate the Tier 1 capital ratio and the common equity Tier 1 ratio.
Is it important to be able to do this math yourself? Nope, but it is important to understand where the numbers come from, the idea behind the ratio, and how it indicates a bank’s financial strength.
Tier 1 Capital Ratio Stats for the Banking Industry
Let’s look at a few stats to understand how different leading banks stand compared to their peers regarding Tier 1 capital.
A few leading banks by Tier 1 capital, in billions:
- JP Morgan – $204.69
- Bank of America – $153.09
- Wells Fargo – $147.54
- Citibank – $136.92
- US Bank – $41.84
- Truist – $39.6
According to the New York Fed, the common equity Tier 1 ratio stood at 12.09 percent for the banking sector at the end of the first quarter of 2022 – well above the pre-crisis level of 2001 to 2006 at 8.25 percent.
Here is a list of some of the common equity Tier 1 ratios for the leading banks:
- JP Morgan – 11.48%
- Bank of America – 10.77%
- Citibank – 11.22%
- Goldman Sachs – 12.54%
- Morgan Stanley – 15.71%
- Truist – 9.23%
- Bank of New York Mellon – 11.33%
- American Express – 11.85%
Final Thoughts
Determining the Tier 1 capital for any bank is a simple formula, especially since banks will provide you with the information. As mentioned before, it is not critical calculating this yourself; it is important to understand the theory and use of the formula.
Banks were the scapegoats for the last financial crisis, and as a result, the Basel Accord created regulations to help ensure that banks had enough capital to survive the next crisis.
As evidenced by the bank’s capital levels and ability to survive the current crisis, I would hazard that those regulations have helped preserve capital and the public’s faith in banks, at least a little.
The big takeaway from today’s post is understanding Tier 1 capital and its impact on the bank’s liquidity and capital. It is also easy for investors to determine the strength of a bank in the coming of a crisis.
That is going to wrap up our conversation for today.
As always, thank you for taking the time to read today’s post, and I hope you find something of value on your investing journey.
If I can be of any further assistance, please don’t hesitate to reach out.
Until next time, take care and be safe out there,
Dave

Dave Ahern
Dave, a self-taught investor, empowers investors to start investing by demystifying the stock market.
