The Tobin Q ratio is an asset-based valuation model that has found its way into many value investor’s playbooks due to its economic logic based around replacement value in attempting to judge whether a company, or the market as a whole, is over or under-valued in the financial markets.
The ratio was popularized by Noble prize winning economic James Tobin in 1969 from who it draws its name.

The Tobin Q ratio can be used to draw conclusions at the company level for investment purposes and also at the overall macroeconomic market level to assist in decision making for tactical portfolio asset allocations.
The Tobin Q Formula
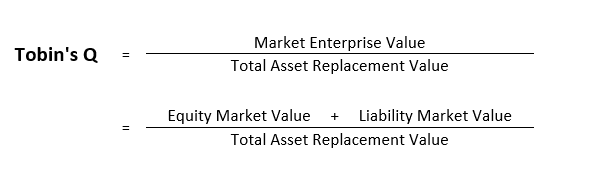
The formula is calculated as shown below and closely resembles the formula of price-to-book value with one twist.
Instead of book value as taken from the company’s financial statement, the formula uses replacement value in an attempt to more accurately capture the economic costs it would take to reproduce the business.
What is Replacement Value?
Replacement value is not to be confused with book value. Unlike book value which is a more informal term for the accounting figures which would be in the financial statements or “books” of the company, replacement value is a more subjective estimate of the amount of money it would take to reproduce a company’s assets.
One of the most notable differences is that items recorded at cost under U.S. GAAP accounting standards should be included at their fair market value. This difference would be most noticeable for items such as historic real estate being held at cost.
Besides from the usual financial statement items that are allowed to be capitalized under accounting standards, replacement value can attempt to take into account intangible items such as management experience and expertise, employee human capital, brand value, and customer relationships.
As one would imagine, this is where replacement value starts to get a little subjective as there is no clear cut way to assign value to these types of items.
Assessing the Market as a Whole
The Tobin Q ratio has probably found its most popular use in being used to assess the overall valuation level of the financial markets.
Looking across the economy, the Tobin Q ratio can be used to judge whether investors are paying too much for the productive assets of an economy and whether society could more cheaply reproduce the country’s asset base compared to its value in the financial markets.
As theoretical as this sounds, it is important from an investor’s perspective in order to judge how expensive (or cheap!) the financial markets are valuing the country’s asset base.
A lower Tobin Q calculation will imply higher equity returns in the future and, vice versa, a higher calculated Tobin Q would imply lower equity returns in the future.
That being said, evidence suggests that valuation discrepancies can exist for an extended period of time before reverting to their average historical level. For the U.S. market, this historical AVERAGE LEVEL for the Tobin Q is 0.7821x. The discrepancy to the theoretical value of 1x can be partly attributed to the more subjective intangible asset values of the country’s businesses not being captured in the economic data.
For the economy as a whole, data used in the computation for replacement value can be found in data published in the Flow of Funds Accounts of the United States-Z.1, published quarterly by the Federal Reserve (https://www.federalreserve.gov/releases/z1/).
In today’s internet age, there are a plethora of sites which track the Tobin Q for the market as a whole so investor’s need not concern themselves with the details of the calculation.
One such trusted site is YCHARTS (https://ycharts.com/indicators/tobins_q) which shows that Tobin Q is currently at 1.142x and well above this long-term average which would suggest low equity returns going forward.
Looking Globally with the Tobin Q
While we have only discussed U.S. markets here, the Tobin Q ratio can also be applied to other country’s financial markets around the world and compared to the average historical reading for each respective market.
Looking across geographies, investors can assess opportunities for tactical asset allocations depending on each country’s respective premium or discount relative to its historic average.
Implications at the Company Level
At the company level, the Tobin Q ratio should be roughly equal to 1 according to economic theory but things can always stray away from this level.
The logic behind the ratio equaling 1 is that in an efficient market, a company would be acquired by a competitor if their Tobin Q ratio was less than 1.
On the other hand, a company with a ratio over 1 would see their business intruded on as competitors put their own investor’s capital to work reproducing the assets of the business in question. This increase in competition would lower profitability across the industry driving the market enterprise value of the company in question down and thus bring the Tobin Q ratio back towards equilibrium at 1.
Solely from the viewpoint of the investor, if the Tobin Q ratio is calculated as being above 1, it shows that financial markets are valuing investments from the company above what it costs the company to produce them. As such, additional capital investment by this company should be profitable for the investor of capital as they will yield even great market value for the company’s suppliers of equity and debt financing.
Alternatively, a Tobin Q ratio below 1 would indicate that the financial markets see any capital investment by the company as being unprofitable. Contributors of new capital to this company could expect a lower market value than the cost of their investment; which implies that no new capital would flow to this area.
Takeaway
The Tobin Q ratio has some interesting implications for assessing the prices of individual firms, business projects, and the level of the financial markets as a whole.
The ratio’s asset-based method revolving around replacement value has made it a favorite among value investors as an alternative to price-to-book value.
On the other hand, the elegant sounding replacement value has inherent subjective flaws in assigning replacement value to intangible assets. This flaw makes it important to focus on averages and assessing relative changes overtime.
