The returns in the stock market and an investor’s actual total return can be very different. If the investor plays his cards right, his total return could actually be better. In fact it should be. Let’s discuss why.
An investor wanting to calculate total return is simply trying to calculate his return on investment or ROI.
If I have $10 and I turn it into $14, I made $4 on my $10 and that $4 is my ROI. To convert that to math terms, we just take the two numbers and express them as a percentage (4/10 = 40% ROI).

When it comes to the stock market, the ROI calculation becomes a little more difficult. Because the prices in the stock market are changing almost every day, an investor’s total return, or ROI, also changes almost everyday.
It doesn’t really make sense to calculate that everyday, so many investors calculate total return on a yearly basis.
Calculating Total Return with CAGR
Another way this is commonly expressed (in the stock market) is with the acronym CAGR, which stands for Compounded Annual Growth Rate. CAGR tries to calculate total return but over a period of many years, and then express it on a per year basis.
For example, knowing I made 10% per year (CAGR) over 15 years gives me a lot more context than a 280% ROI over 15 years—even though both calculations mean the same thing.
Having an annual comparison allows us to compare things apples to apples and also compare it with everything we hear about the stock market, as the news and media often report on total return as a per year number.
Before we can move along with a practical way for the average investor to calculate his/her total return, we have to understand that there’s another factor that contributes to total return: dividends.
You might hear of dividends expressed as yield, and that’s because yield is just a way to tell you how much income you receive from an investment as a percentage. For example, if I make an investment for $100 and it pays me $2 per year in interest, then I have a 2% yield [(2/100) x 100].
With the stock market and dividends, yield is calculated the exact same way—just substitute the words “make an investment” with the words “buy a stock” and “pays me a dividend” instead of “pays me interest”.
The way that yield relates to total return is that it enhances it, and enhances it a lot if you are reinvesting that yield.
How Yield Enhances Total Return
The way that returns get enhanced from income streams and yield is through compound interest.
If I receive $2 from a $100 stock and I reinvest it to buy more shares, then the next year I have 1.02 shares and would receive a $2.04 dividend instead of a $2 dividend because of those extra shares.
That doesn’t sound like a lot, but over time that can build up really fast because of compound interest.
When you also take into account the fact that many stocks raise their dividend every year, you speed up the compound interest process and enhance total return exponentially.
Taking that same example, let’s say our dividend stock grew its dividend by 10% per year, and we continued to reinvest the shares. After 20 years, our 1 share would grow to 1.4 shares. If the stock were to also grow 10% per year (the historical stock market average) along those same 20 years, our 1.4 shares would be worth $856.23 (1.4 shares x $611.59 stock price).
Now, this example perfectly shows us the difference between stock market returns and investors’ actual total return, and here’s why.
Say our $100 stock represents the total stock market. Like in our example, that stock grew 10% per year (CAGR), and so instead of being at $100 it trades at $611.59 after 20 years.
The media would calculate total return by calculating the CAGR between year 1 and year 20, and come up with a total return figure of 10% per year CAGR.
Notice how there’s no consideration for the dividend yield that would’ve come while holding the stock.
But remember that in our example we were reinvesting our income to collect more shares from our yield. At the end of the same 20 year period, we would have 1.4 shares and our total investment would be worth $856.23. Using a CAGR calculator, the real ROI from $100 to $856.23 in 20 years would be a 11.33% CAGR, and not the 10% CAGR that the media reports.
Again that doesn’t sound like a lot, but consider that it’s a difference between a 756% ROI (7.5x total return on the money) vs. a 511% ROI (5x total return on the money).
An investor can then achieve much higher returns from the stock market than the return figures they see in the media just by buying and holding and reinvesting their dividends.
How to Calculate Actual (!) Total Return for the Average Investor
Now for the practical way for the average investor to calculate total return. It’s a simple calculation just like in our example. But, it’s NOT the way that the standard brokerage calculates your return.
All you have to do is to use a free online CAGR calculator and input your total account value into the “Ending Value”. Then for your “Starting Value”, just add up however many contributions you’ve made over the life of the account. Finally, figure out how many years the account has been open and enter that for “No. of Periods”.
What this will do is include all of the extra return you’re getting from your reinvested shares with the other standard Gain/Loss numbers. Your broker probably adds your reinvested dividends to your Cost Basis (mine does), which actually deflates your account total return calculation on the screen. It’s not what you’ve really earned.
You can also use this method to compare your actual return to the returns posted by the media. Many times during bear markets they will reference annual stock market returns with no regard to returns from dividends, and so it’ll sound a lot worse than it really is.
Which brings me to my final point.
Keep in mind that the returns from the stock market can vary wildly from year to year. Just check out this chart for the first 18 years of the 2000s.
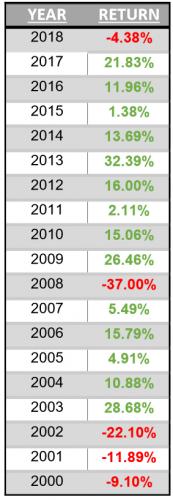
That is just the nature of the beast. As you start investing, you might see your own total return calculations fluctuating just as wildly as the chart does.
But you shouldn’t worry about it. While in the short term the stock market acts like a roller coaster, over the long term the stock market grows steadily as the business world around us grows.
How to Maximize Your Actual Returns
As long as you believe that the business world will continue to make profits and create products and services that consumers will buy, then you can feel confident that the stock market will continue to grow around 10% CAGR as it has averaged since the early 1900’s.
The key to achieving that type of a consistent total return though depends on you implementing stock market fundamentals such as:
- Diversification
- Being patient
- Buying and holding over the long term
- Reinvesting your income
To really master these fundamentals, you need to understand that the stock market goes through cycles just like the weather, you need to understand why it’s important to buy whether the stock market is up or down through dollar cost averaging, and you need to understand how it’s actually pretty simple to determine which stocks to avoid so that you minimize your losses as much as possible.
Whether you’re trying to calculate total return for your 401k, your mutual funds, or your stock portfolio, you need to calculate it in the same way.
Consider how your income streams can amplify your actual returns, and do your best to take advantage of it as much as possible.
