Everything you’ve ever heard about diversification, and overdiversification, is wrong! The conventional wisdom is that any portfolio over 20- 30 stocks is overdiversified. This is wrong!
The traditional idea about stock portfolio diversification is that anything more than 20 stocks, and your portfolio will track the market.
In other words, if you’re buying more than 20 stocks, you might as well buy a market index fund.
Like most investors I took this traditional “overdiversification” wisdom at face value.
But like many things with investing and the stock market, you can’t assume that even your most basic assumptions are always correct. Always question everything.
We’re going to chase down some evidence from books and academic studies, before finally talking about how to apply it to your own portfolio. Some of the topics for this discussion will include:
- The Basics of Risk with Stocks
- Academic Study of How Stocks REALLY Perform
- Additional Considerations to Overdiversification
- That Magical 30% Number
Let’s start with two investing bestsellers that have become almost required reading for the average investor—The Intelligent Investor and A Random Walk Down Wall Street. Both books generally espouse a diversification strategy of 15-20 stocks for the stock picking investor.
What Everyone Has Told Investors About Diversification
From the value investors’ “bible”, The Intelligent Investor:
“The selection of common stocks for the portfolio of the defensive investor should be a relatively matter…
There should be adequate but not excessive diversification. This might mean a minimum of ten different issues and a maximum of about thirty”.
Interestingly, the book’s author Benjamin Graham doesn’t provide any explanation to why he picked this range, and this framework has continued to be shared many decades later. The idea being that any portfolio with more than 30 stocks is “overdiversified”, which has been “confirmed” by later academic studies. More on that later.
From the indexers’ “bible”, A Random Walk Down Wall Street:
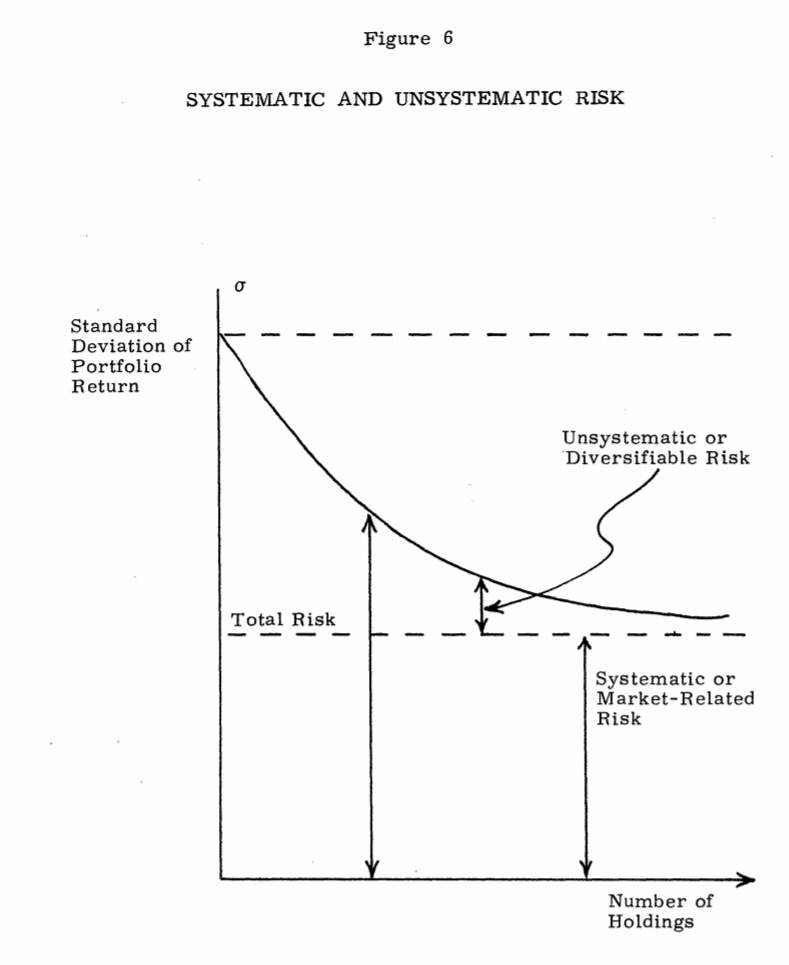
“When 10 securities are selected for our portfolio, a good deal of the unsystematic risk is eliminated, and additional diversification yields little further risk reduction. By the time 20 well diversified securities are in the portfolio, the unsystematic risk is substantially eliminated and our portfolio (with a beta of 1) will tend to move up and down essentially in tandem with the market.”
The author for this book, Burton Malkiel, also includes a chart sourced from a study by Modigliani and Pogue to illustrate how risk tails off as the number of stocks in a portfolio increases.
In other words, according to their chart and quote, adding any additional stocks after having 20 is basically another example of overdiversification.
Here’s an example illustration:
The Basics of Risk With Stocks
A few definitions before we continue.
Systemic risk: The risk experienced by all stocks. For example, in a stock market crash, almost every stock will crash regardless of the company’s strength. This tendency for all stocks to move together due to market sentiment is a component of systemic risk. In general, you can’t reduce systemic risk for a portfolio of stocks through diversification.
Unsystematic risk: The risk related only to an individual company. When a company goes bankrupt and shareholders get wiped out, this is an example of unsystematic risk. In general, the more stocks in your portfolio the lower the unsystematic risk, except of course once you reach the point of “overdiversification”.
Now, why Malkiel and so many others consider a portfolio of greater than 20 stocks to be overdiversified stems from a couple of academic studies.
Let’s look at the one referenced in the book first—An Introduction to Risk and Return by Franco Modigliani and Gerald A. Pogue.
Now, I’m going to quote this paper because it describes this phenomenon:
“On the average, approximately 40% of the single security risk is eliminated by forming randomly selected portfolios of 20 stocks. However, it is also evident that additional diversification yields rapidly diminishing reduction in risk. The improvement is slight when the number of securities held is increased beyond, say, 10.”
Right away we can see where the 15-20 stocks framework comes from.
If the unsystematic risk can mostly be whisked away after 10 stocks, after which additional diversification creates diminishing returns for managing risk (overdiversification), then the 15-20 stocks framework sounds sound.
But, if you were to read the study closely, you might observe that risk as defined by Modigliani and Pogue referred to the standard deviation of the portfolio. We might call that “beta” today, or volatility.
So according to these theories, a portfolio of 15-20 stocks is supposed to basically track a market index because it has the same standard deviation (volatility, beta) of the index.
But this isn’t always true (even mostly not true).
Academic Study of How Stocks REALLY Perform
To truly understand the nature of the market, which uncovers why 15-20 stocks actually isn’t an example of overdiversification, we need to understand how averages work.
In any given year, the average returns from the stock market might look something like this:

You have some stocks that do really well on the right tail, some stocks that do very poorly on the left tail, and the big chunk of stocks which perform somewhere close to average.
But actually, the real distribution of stock market returns in any given year (this one from a study by Hendrik Bessembinder looking at all CRSP common stocks from 1926-2016) looks like this:
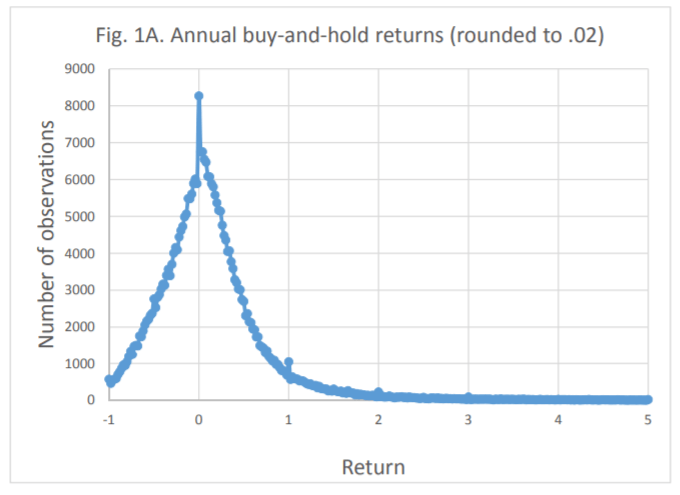
Notice two things here.
- The maximum loss on a stock market investment is -100% (-1 on the chart)
- The maximum return on a stock is infinite (theoretically). So you can see returns of 200%- 500% depicted on the chart.
This imbalance between potential loss and potential gain means that a few super high performers could skew the averages higher than the losers drag them down, especially if the super high performers were stratospheric (like Altria Group with a lifetime buy-and-hold return of 244.3 million percent).
To really get the significance of this, we have to understand averages.
If you were to take 5 numbers, say it was:
2%, 2%, 2%, 2%, 60%.
If you wanted to really describe to someone what this group of numbers looked like, it would be more accurate to talk about the average as closer to 2% than 60%.
But that’s not how math works.
Take the average of the five numbers and notice the result:
Average= (2%+2%+2%+2%+60%) / 5
Average= 13.6%
What would’ve been a better representation would’ve been the “median”, which takes the middle point of a group of numbers.
Say that the 60% number was 600% instead. Now the average is 121.6%, and the 2% figures are largely inconsequential.
This is because it takes just one outlier datapoint in a group of numbers to wildly skew an average of numbers.
The Law Of Averages and Stock Market Returns
Take this to the stock market now. Because you have this possibility of companies posting stratospheric returns which can largely overshadow many losers, you have stock market averages which get pushed up which don’t necessarily represent the overall group of stocks.
Turns out there was a study which found out exactly that.
In Why active fund managers often underperform the S&P 500: The impact of size and skewness, Ikenberry, Shockley, and Womack found that from 1962- 1995, the difference between the mean (average) and median was close to +4%, or 3.92%.
In fact, out of all 33 years examined, the mean of the stock market was lower than the median only 3 times!
What this tells us is this:
There is evidence that a small minority of outliers (super performers) push up the stock market average return and thus drive much of the return.
In fact, Hendrik Bessembinder’s report from 1926- 2016 found that only 30.8% of all stocks outperformed the average stock return over their lifetimes.
So while you might think that 50% of stocks outperform the market and 50% underperform, it’s closer to a 30%-70% split, with the outliers pushing the huge lead (close to +4%) between winners and losers.
How Real Stock Performance and Overdiversification is Tied
As investors trying to build a portfolio, we have to take these realities into consideration when trying to capture as much as that upside as we can.
Take your standard 20 stocks portfolio.
In that case, you are picking what you believe to be the top 4% of companies (if we are comparing the entire universe as the S&P 500 for simplicity).
Does a portfolio of 15-20 stocks give you enough of a chance to pick one of the super performers?
It’s difficult to quantify exactly what percentage of stocks become super performers in any given time, and how many you’ll need to beat the stock market.
I’ve seen estimates showing that anywhere between 2% – 5% (ish) of companies have driven much of the return of the market at any given time.
I think that’s extreme, but play it out for a second.
If only 2% of companies in the S&P will ever earn stratospheric returns, then that’s only 10 companies. That is a 1 out of 50 chance.
If you picked a portfolio of 25 stocks, chances are probably close to 50-50 that you won’t get one of the super performers in your portfolio.
If you extend your portfolio out to 50 stocks, your 1-in-50 odds are much better.
So, even if a 15-20 stock portfolio is effective in reducing portfolio volatility, it is not as effective in exposing your portfolio to the (maybe) 2-5% of companies which drive the +4% difference in annual returns between the average and the median across all stocks.
Additional Considerations to Overdiversification
Of course, we also have some common sense parts of overdiversification which would limit the 15-20 stocks framework as well.
- For example a portfolio with heavy allocations to particular sectors or industries will likely diverge from stock market averages both by standard deviation (beta) and return, regardless of how many stocks are in the portfolio.
- A portfolio with heavy weightings in various factors—such as small cap, large cap, international, growth, or value—will not as easily track the stock market index because many of these factors move together.
- Many different macroeconomic factors often moves groups of stocks together; even changes in interest rates will hurt and help certain stocks and industries more than others.
So to truly diversify a portfolio, you really need a pretty large basket of stocks, which is why index funds are so widely popular.
That’s a more difficult question to answer than it sounds.
As it comes to diversification, and then overdiversification, where is the limit?
Most proponents of index funds will tell you to just buy an S&P 500 index. But that index necessarily contains an overexposure to the U.S. economy, being comprised of mostly U.S. stocks.
Whether you think adding international diversification is a form of overdiversification or not is a personal choice.
At the same time, there’s a million other things you could hedge to as well. Maybe you’re not confident about fiat currencies like the U.S. dollar, at which point neither international ETFs nor market ETFs probably don’t give you diversification from that “risk factor”.
But adding all of these layers of diversification is guaranteed to do one thing—lower your return.
You can’t have your cake and eat it too.
If you want international diversification for example, you can’t be upset with below average returns if the U.S. economy continues to be a dominant global force. A situation like that will power the S&P 500 above many other stock markets in other countries, and if you’re overdiversified on top of an S&P 500 index your results will be lower than that average.
It’s all about picking what risk you are comfortable with, and what you want to diversify away.
Here’s how I’m approaching all of these ideas with my portfolio as it evolves today. Maybe it can give you some ideas—but by all means it’s a very personal decision.
Applying Diversification and the Distribution of Stock Market Returns
Because I am a value investor at heart and I tend to look for cash cow, more matured and stable businesses, my chances for picking a 2%-5% super performer are pretty low most of the time.
But I still need to incorporate the realities of stock market returns into my strategy.
The two biggest takeaways I have from this research:
- Plan for only 30% of my stocks to outperform
- Make sure that the 30% of outperformers are enough to drive the mean-median stock market returns gap (+4%)
Of course there’s going to be wild variations of this while managing the actual portfolio, for simplicity sake let’s assume that 70% of my stocks underperform the stock market average (10%), and calculate how much my winners would have to gain to make up the difference.
I’ll use 9% return to characterize the underperformers, which is of course highly optimistic. But this at least gives us an idea of our “minimum” outperformance needed.
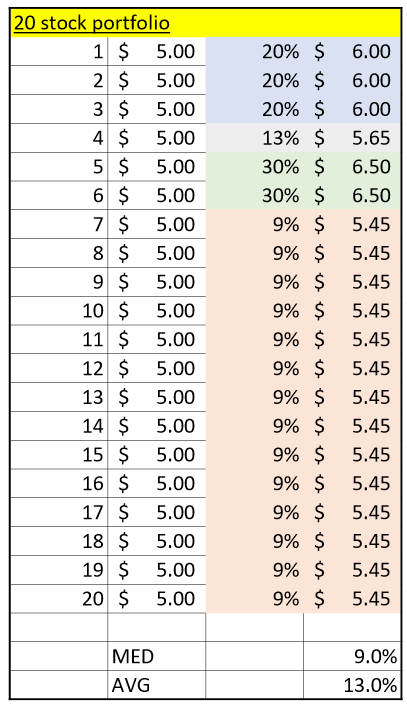
I tried to lay out an example as simple as possible.
You can see that with 70% of the portfolio underperforming, we’d need two stocks (10% of portfolio) to triple the median (+30% gain), 3 stocks to double (+20% gain) and one stock to slightly outperform (+13% gain) in order to bring the entire portfolio closer to the stock market reality, where the average is skewed higher than the mean.
This doesn’t seem out of reach even for cash cow/ matured businesses, more on this in a little bit.
Here’s another similar example but with a 40 stock portfolio:

Notice that the number of +30% winners needed has dropped from two stocks (10% of 20-stock portfolio) to three stocks (7.5%) of a 40-stock portfolio.
Another way to compare the two portfolios is as such:
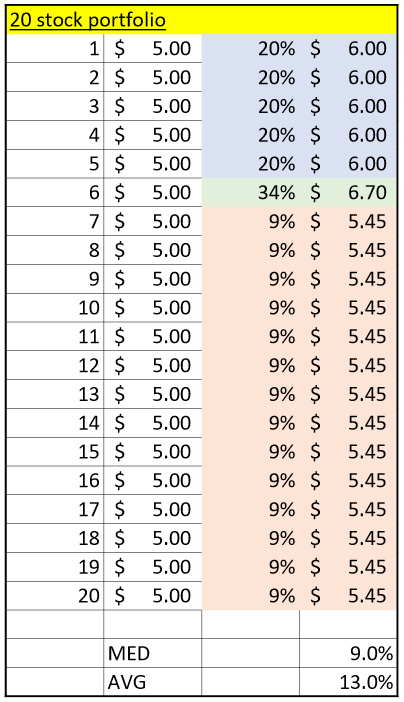

We can see how our outlier with stratospheric returns needs to earn higher outperformance the greater the number of stocks in the portfolio. However, having 40 cases of ammo instead of 20 in the form of stock picks might make the extra diversification worth it. In essence you are doubling your chances of finding that outlier, which is what you’ll likely really need to match risk and return with an index.
Just to complete it with one last example, here’s the required outperformance with a 60-stock portfolio:
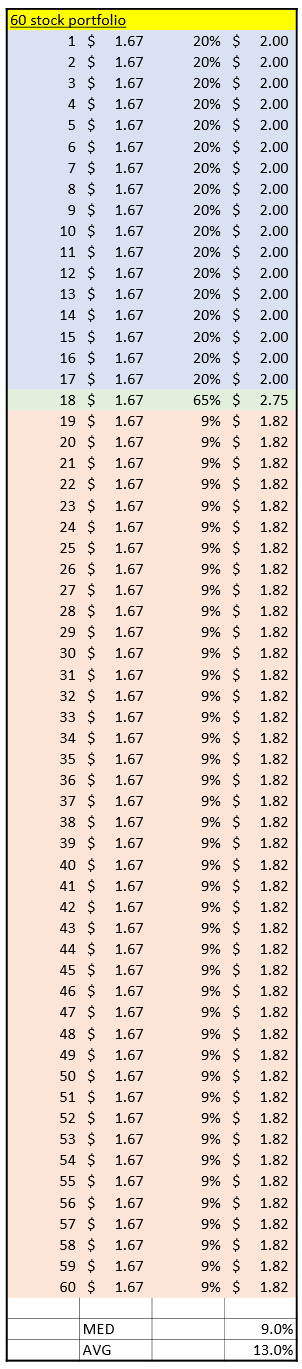
That Magical 30% Number
I want to present one last interesting tidbit of information when it comes to historical stock market (and business) performance.
I took a dataset of 20 years of financials for the S&P500 constituents as of mid-2020, which represented financial statements filed from 2000-2020. Then I simply took the median values of EPS growth for that time period for each company, and compared the values.
Of the 500 companies, the percentages that grew at each rate over 20 years:
- Median of 5%+ EPS growth rate annually = 52% of companies
- Median of 10%+ EPS growth rate annually = 30% of companies
- Median of 15%+ EPS growth rate annually = 13% of companies
- Median of 20%+ EPS growth rate annually = 5% of companies
- Median of 25%+ EPS growth rate annually = 2% of companies
- Median of 30%+ EPS growth rate annually = 1% of companies
Disclosure: Now of course this dataset (and findings) aren’t perfect. There’s survivorship bias, as many of the underperformers of the past have since been dropped from the S&P 500, so it’s likely that the aggregate averages actually skew lower for any S&P 500 company you might choose to invest in. Also, I didn’t take the entire universe of stocks over the same time period, but just took the S&P500 constituents from a particular point in time.
That 30% number has popped up again, and maybe it’s no coincidence that the percentage of companies who have maintained an EPS growth roughly double nominal GDP (+4.5%) is almost the same as the percentage of stocks which have historically outperformed the market according to Bessembinder.
Going back to my matured, cash cow, dividend-focused stock picking approach—having a 20 or 40 stock portfolio where I need around 10% of my positions to outperform by 3x seems pretty reasonable seeing as 13% of the companies covered above earned 15%+ EPS growth (3x nominal GDP).
Same with having 30% of my portfolio with outperformers which 2x the median, where 30% of the companies above earned 10% (2x nominal GDP).
None of this is a perfect science, but it does give more food for thought with portfolio construction.
As it comes to overdiversification and its possible insidious effects to a portfolio, I’ll admit that my mind is now changed.
Although 15-20 stocks has long been the traditional wisdom with stock picking diversification, I think the scope should be closer to 25-50 stocks—assuming an investor can keep up with that many.
For full-time practitioners, it totally sounds within a reasonable range, and probably gives an active manager a better chance at surpassing a market index over time.
