Measuring how much a company is growing in size, and how much it has grown its dividend, is only one part to finding great dividend growth investments.
Just like many metrics used today don’t consider both aspects of sustainable growth (as we discussed in the part 2 of this dividend ratio series), there’s a part of the returns from dividends that isn’t considered when calculating a standard dividend payout ratio.
The dividend payout ratio is a very common metric, but not much is discussed beyond the surface level of it.
In a nutshell, the payout ratio tells us how much big a stock’s dividend payments are in relation to their EPS (earnings per share).
Investors generally like to see a low dividend payout ratio, because it means that the company has a large “cushion” of earnings compared to how much they are paying out. Basically, the company can sustain or grow the dividend with ease when the payout ratio is low, because there’s plenty of earnings to pay it and other things.
However, there’s not much talk about dividend payout ratios that are too low.
Problems with the Standard Dividend Payout Ratio
While a payout ratio that is too high can signal a company that’s not leaving enough wiggle room for reinvestment into future growth, one that is too low can signal a company that isn’t giving enough capital back to shareholders.
A dividend that’s very small can certainly grow, but if it’s so small compared to what the company is capable of, the investor can be missing out on big potential returns.
Also, a small initial dividend payment can lead to an investor underperforming a stock with a bigger dividend payment even if the growth rate is higher. So though we got a great calculation on sustainable dividend growth in part 2 of this series, you can see it doesn’t tell the complete picture.
To really evaluate a stock’s dividend payout ratio in a way that represents this concern, we should look for a range of acceptable payout ratios rather than just saying “lower is better”.
There’s one major pitfall with the regular payout ratio that also needs to be discussed. It’s not considering all possible dividend payments, i.e. special dividends.
A special dividend is cash just like a dividend payment is… $1 in special dividends increases your account just as much as $1 in a regular dividend. However, with today’s general obsession on dividend growth rates, investors frequently forget about special dividends.
Oftentimes, smart management will pay a special dividend when they don’t see any better alternative for the capital they’ve earned (from EPS).
They can identify when reinvestment in particular assets will be largely inefficient, and we should recognize and reward those smart decisions– with our investment dollars.
It’s from these problems and drawbacks that I propose calculating what I call the 10 Year True Payout Ratio. It’s simple, yet effective, and identifies when capital is being returned to shareholders prudently and sufficiently.
But before I introduce the metric, let me be clear on why I chose to look at the payout ratio over a 10 year period.
Why 10 Years for the Calculation?
Just as a 1 year snapshot of growth rates can be deceiving (discussed in part 2), so can a 1 year look at the payout ratio, which is most common use of the payout ratio.
To mitigate this, we will take a 10 year snapshot of the payout ratio. Instead of seeing how much capital (EPS) a company is allocating towards dividends this year, I want to see how it’s been done historically, over the last 10 years. It’s simply a more accurate picture.
Additionally, we want to include all aspects of dividend payments– regular dividends and special dividends.
For the 10 year component of the dividend payout ratio, I’m going to take the sum of all of the dividend payments over the past 10 years. There’s no need for 3 year averages (like with the BB Div G) because we aren’t looking at growth rates here.
This calculation is even more simple than the one for dividend growth.
True Payout Ratio = [(10 Year Sum of Dividend Payments + Special Dividends) / 10 Year Sum of EPS] x 100
Because this metric isn’t black-and-white, you don’t want it too high or too low, we simply want to see it in a range between 25-75. The average payout ratio historically has been around 50%, so we want to get to see company’s with a true payout ratio as close to that number as possible.
True Payout Ratio Example: $COST
Let’s take a stock that has a grand reputation for consistently paying special dividends, and see how much earnings are really going back to shareholders.
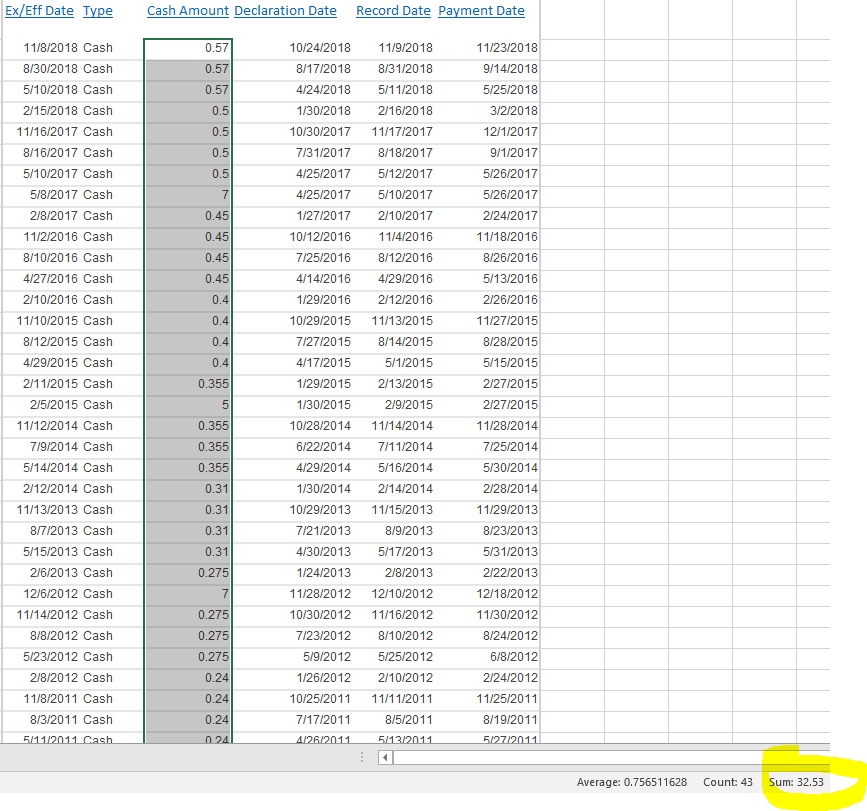
To create this table, I simply Googled “cost dividend history” and went to the NASDAQ.com page. From here, you can copy and paste the values into Excel or Google Spreadsheets. Then, if you just select the whole Cash Amount column, you can see the sum of all dividends in the bottom right corner.
I only copy and pasted values from 2009 – 2018 to give us 10 years of data. The result of total dividend payments comes out to $32.53.
Now it’s time to get the 10 year sum of Diluted EPS for $COST. I always use Diluted EPS because it accounts for stock options that have been given out to employees, which becomes a real expense eventually.
This time I’m going to use a website called quickfs.net, and copy+paste the values into again to quickly sum the EPS over 10 years.
I actually used Google Sheets for this one because I was having trouble getting the data over to Excel in the correct format. To get it to work in Google Sheets, you just have to right click and select “paste special –> values only”.
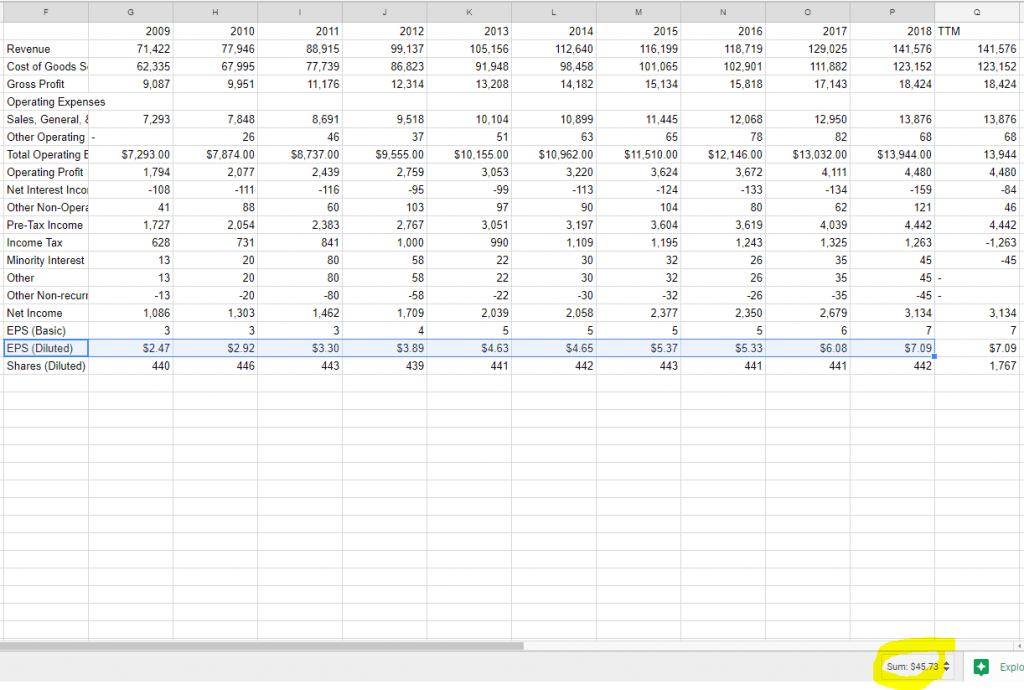
This returns a 10 year EPS sum of $45.73.
The calculation is real simple from here. Remember, the True Payout Ratio = [(10 Year Sum of Dividend Payments + Special Dividends) / 10 Year Sum of EPS] x 100, or (32.53 / 45.73) x 100 = 71%.
As we can see, $COST does a great job of paying much of its earnings back to shareholders without going overboard. The True Payout Ratio falls inside of the 25-75 range we established earlier.
We can also see that the company’s current payout ratio of 0.3, or 30%, doesn’t quite represent how much return you get in dividends from buying the stock.
Sure, a payout ratio of 30% is also in the desired range, but it’s not a full representation of how much management is trying to return to shareholders, regardless of what is happening with the yield and the stock price.
These are important distinctions (dividend yield vs. true payout ratio), and were covered more in-depth in part 1. Basically, we want to evaluate management based on things that they can control, and not on things they can’t.
There’s one final step to all of this.
We’ve established how to identify high dividend growers and evaluate whether that growth is sustainable in part 2 with the BB Div G ratio, and we’ve shown how to identify stocks that are pumping out dividends with the True Payout Ratio.
You need to not use one metric or the other, but both of them combined, if you really want to get the sweet spot of a dividend history of growth and return. Click below for the conclusion to this series: part 4.
Dividend Ratios Pt. 1: Evaluating the Dividend History of a Stock
Dividend Ratios Pt. 2: How to Identify Sustainable Dividend Growth
Dividend Ratios Pt. 3: Measuring a Stock’s True Dividend Payout Ratio
Dividend Ratios Pt. 4: Combining Two New Metrics & Putting It All Together
