Updated 2/7/2024
When valuing a company, the primary imperative is to use the most up-to-date numbers we can find. Numbers such as prices constantly update in the markets. But the accounting inputs we use come from accounting statements such as the income statement, and those don’t update constantly.
So what is the answer? The challenge as investors remains to get those financial statements as updated as possible, keeping in mind that in the U.S., companies update their income statements at best once every three months.
The answer is a method known as the TTM or trailing twelve months.
For example, we are trying to value Apple, and they released the latest 10-k in November, but it’s October. We can go back to the last 10-k from 2023 or guess using the latest quarterly report. Even better, we could take the latest quarterly report, take all the numbers, and multiply them by four.
None of those options is the best; a better bet is to use the trailing twelve-month method of finding our closest correct numbers.
In today’s post, we will learn:
Okay, let’s dive in and learn more about TTM finance and how it impacts our company analysis.
What is TTM in Finance?
The trailing-twelve-month term used in finance describes the past twelve months of its financial performance. The twelve months highlighted don’t always coincide with the end of the fiscal period for the company.
For example, the TTM may be a combination of the six months before the end of the fiscal period and the following six months past the beginning of the new fiscal period.

Many analysts and investors use the TTM to analyze financial data, such as income statements, balance sheets, and cash flow statement figures.
The TTM methodology may differ from one statement to the next.
Some analysts report earnings quarterly, while others do them annually.
However, investors looking to value companies based on schedules not governed by these often look to the TTM to fill that need. The TTM is often the most updated to-date figure and is seasonally adjusted.
Using the TTM in the P/E Ratio
Investors use TTM numbers in ratios such as the P/E ratio. The price/earnings ratio comes in many flavors, such as P/E FWD (forward), P/E TTM, or P/E GAAP (Generally Accepted Accounting Principles).
Using the TTM figures allows you to determine the most current calculation of the P/E ratio. We can calculate the ratio by dividing the current market price by the company’s trailing twelve-month earnings per share.
Using relative valuations requires comparing multiples across industries, sectors, and companies. The best way to ensure your multiple compares apples to apples is to use the most current numbers or TTM.
Comparing a forward P/E to a TTM P/E can lead to errors in valuation because those multiples are not based on similar numbers.
For example, look at the different P/E ratios available for Apple:
- P/E TTM – 37.52
- P/E FWD – 31.12
Notice a wide gap between the two and how much that would throw off your valuations.
A better method of analyzing the financial statements simultaneously remains using TTM or trailing twelve months for each period you analyze.
For example, suppose you noticed that your company had revenues of $500 million during a previous TTM. In that case, it is even more brilliant if you notice that the company grows revenues to $1 billion in the next comparable period.
TTM vs LTM
LTM or the last twelve months refers to the period immediately preceding the trailing twelve months.
Many companies will reference LTM regarding debt-to-equity (D/E) metrics or revenues in their financial performance.

Twelve months is not a long time to evaluate a company in the grand scheme of things. A better time frame is five to ten years, but in the short-termism of Wall Street, LTM or TTM is quite common.
The most beneficial impact of TTM is that it indicates a company’s most recent performance. It gives you a useful framework when used in conjunction with longer-term comparisons.
Another benefit of TTM numbers is that they help smooth out any seasonal changes to performance, possible short-term price volatility, and, in more recent times, short market swings.
Think about the impact of the holiday seasons on retail or summer vacations in the travel industry. If you focus on the quarterly results in June or December, your analysis might skew higher or lower than reality. Using TTM helps smooth out those variations.
TTM or LTM numbers provide updated metrics from the metrics reported by the company’s annual or quarterly reports.
Essentially, trailing twelve months or TTM is interchangeable with the last twelve months or LTM. And much of it will depend on the different companies and how they report their numbers.
Okay, now that we understand the basics of TTM in finance, let’s calculate it.
How is TTM Calculated?
When reviewing figures shown in the twelve-month trailing, investors should never assume those numbers coincide with the company’s most recent fiscal year.
Companies file their financial documents at the company’s fiscal year-end. The numbers listed refer to the last twelve months ending on the financial statement’s last day of the month, such as June 30 or December 31.
For example, in a financial statement dated March 2020, the last twelve months’ numbers cover the period from April 1, 2019, through March 31, 2020.
As mentioned earlier, not all financial statements are equal when calculating the TTM. For example, companies create quarterly income and cash flow statements to represent their current progress.
The balance sheet reports a twelve-month measure containing a snapshot in time. Visa calculates the balance sheet every quarter.
Analysts treat line items from the cash flow statements, such as working capital, capital expenditures, and dividends, as feeders for other financial statements.
Working capital gives us a great example of these calculations, which come from items on the balance sheet and are then averaged. However, analysts deduct depreciation from income quarterly and then look at the last four quarters reported on the income statement.
The simplest way to calculate numbers from the trailing twelve months remains by adding the three-month periods that divide the fiscal year by the previous four quarters.
For example, let’s start with the most recent quarter. To make a TTM calculation in October 2020, we would begin with Q3, which ended in September 2020.
Next, we add on the preceding three quarters; simple, huh?

Alternate Methods
You could try another possible calculation, albeit a bit more complicated.
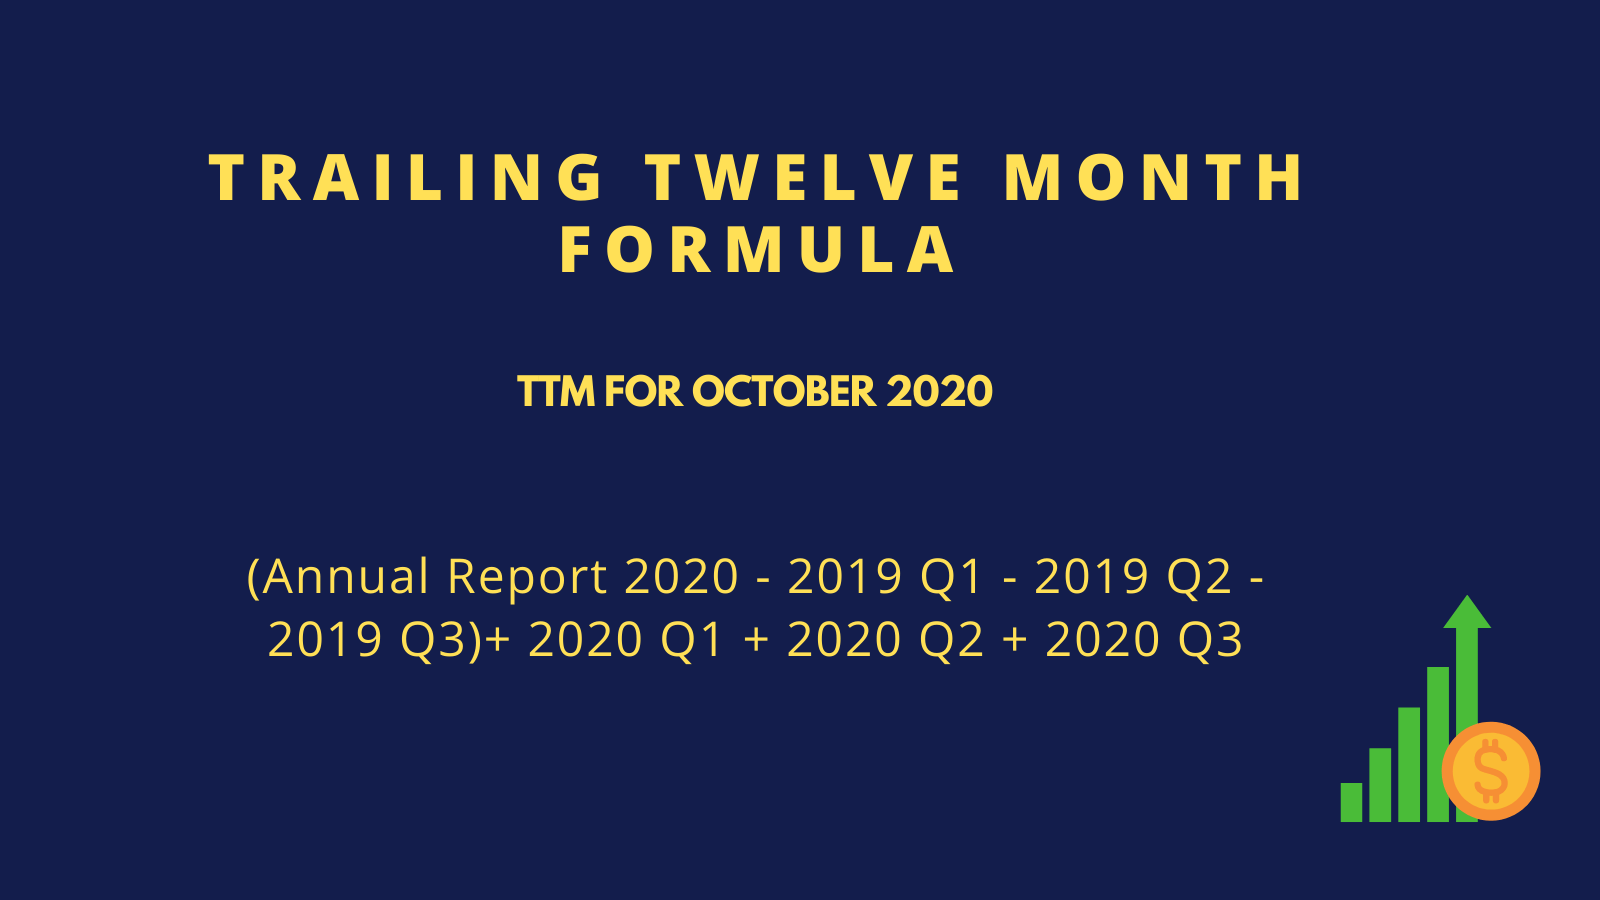
It comes down to this: we start with the annual report or 10-k, add the reports for any quarters following the annual report, and subtract the corresponding quarterly from the annual report.
Here is what that method would look like if we used the TTM for October 2020.
And finally, we could use the following formula to achieve the same result.
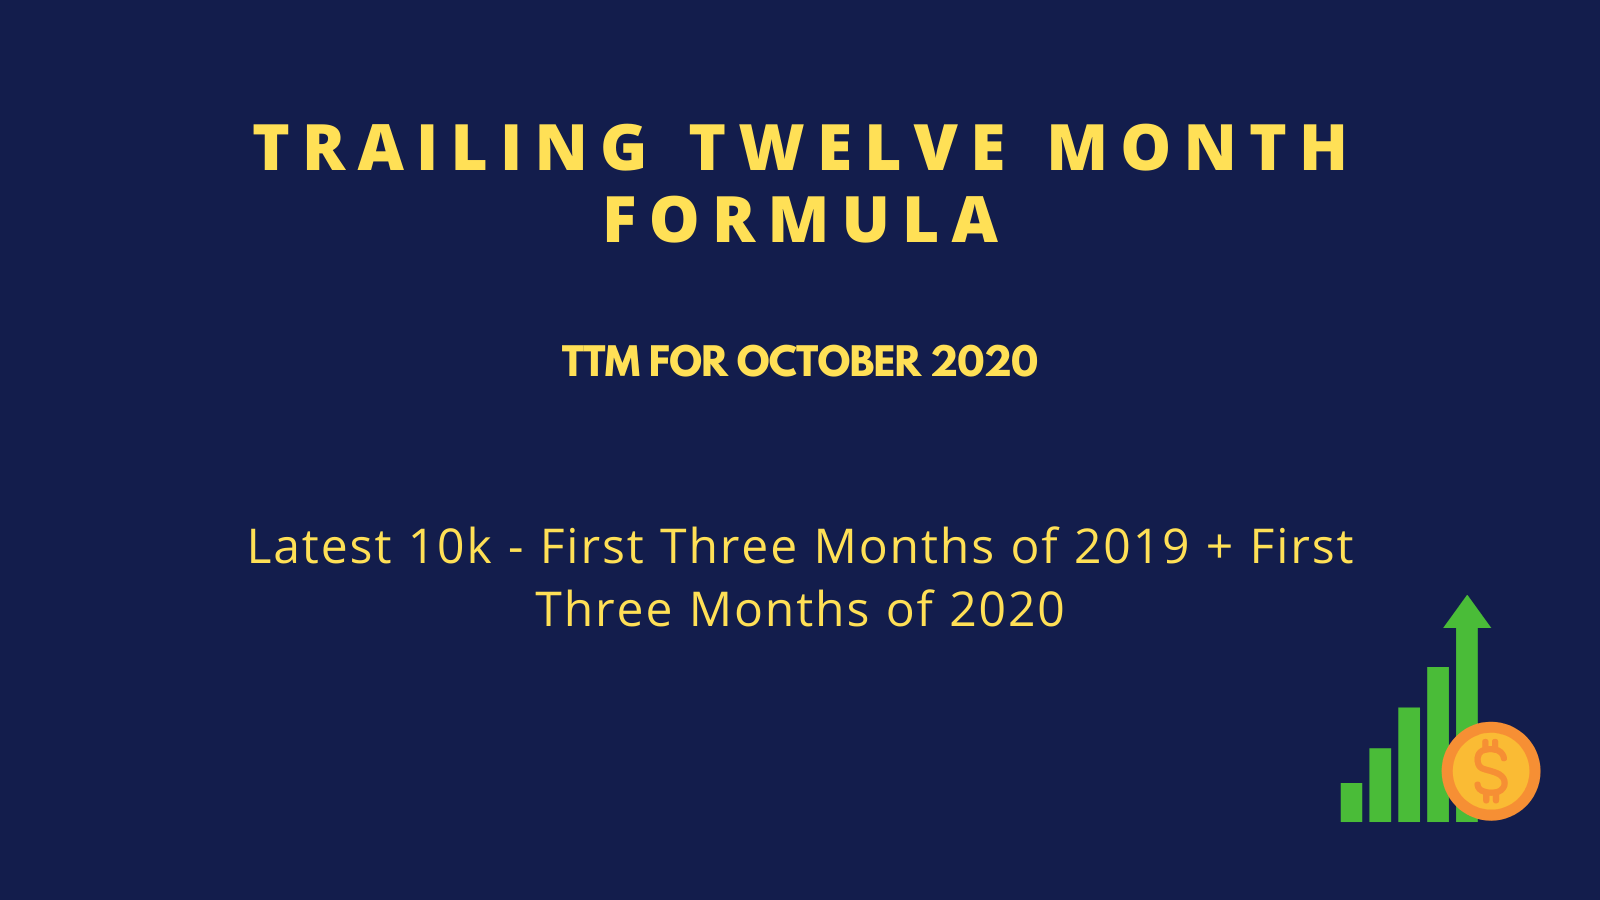
Using this version of the formula enables us to only look at three documents:
- The latest 10-k or annual report
- The quarterly or 10-q report for the first nine months of 2019, issued around October
- The quarterly or 10-q report for the first nine months of 2020, issued around October
Example: Amazon (AMZN)
Let’s roll with a company to see how this lays out.
How about we use Amazon (AMZN) as our guinea pig? Amazon’s fiscal year ends in December, so we can plan out the financials we need to access to find our numbers for Amazon’s TTM earnings.
If we are looking at analyzing the company in November and want the most recent earnings to analyze, our TTM will line up as the following:
- For the first nine months of 2021, we look at the first quarterly report, which ended on 3-31-2021
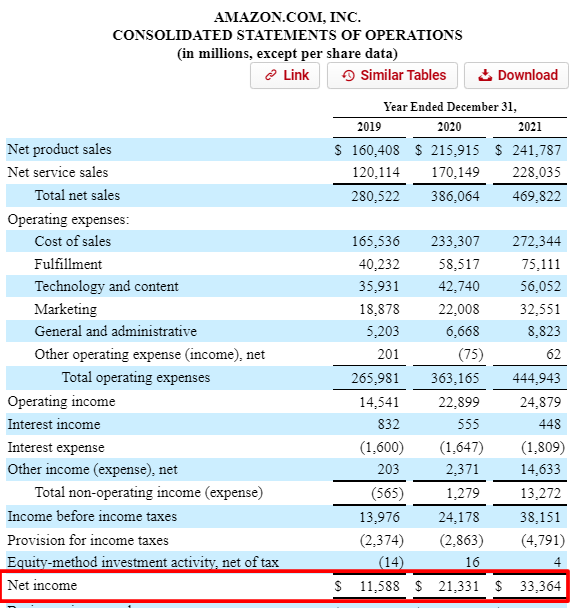
- The 10-k report, which ended 12-31-2021
- The first three months of 2022, which ended on 3-31-2022
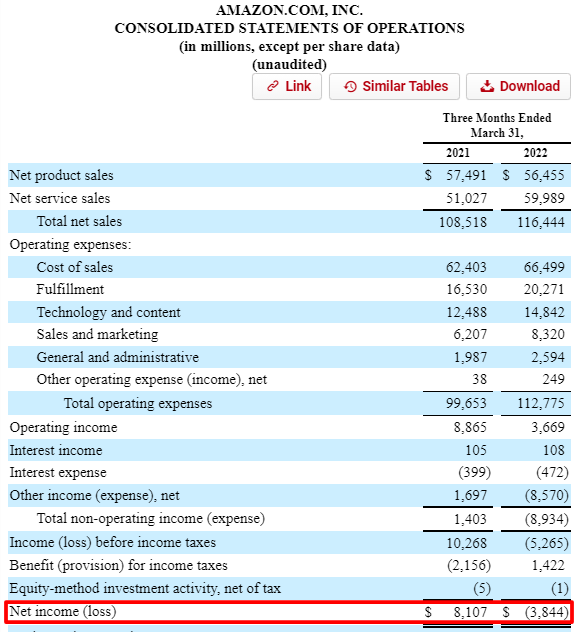
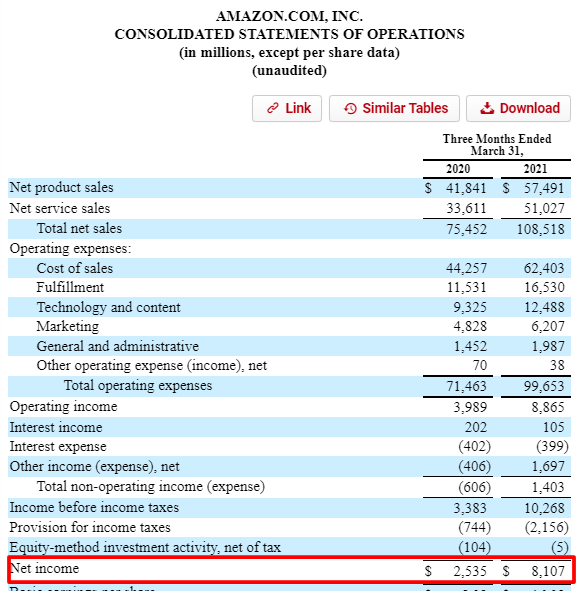
Now, if we access those documents, we get the following numbers:
2021 Q1 | 2021 10-k | 2022 Q1 |
Page 4 | Page 38 | Page 4 |
$8,107 | $33,364 | ($3,844) |
Now that we have all our numbers, we can plug them into our formula and determine Amazon’s TTM net income in November 2020.
TTM net income = $33,364 – $8,107 + ($3,844) = $21,413
Below is a simple TTM calculator you can download to make these calculations easier; I included other line items such as revenues, interest expense, and operating income. However, you could add any line items you wish and use the created calculations to make the process easier.
That was kind of simple and fun. If we wanted to know the current earnings per share or EPS for the TTM, we located the shares outstanding from the same income statement ending 3-31-2022 and divided them by the TTM net income.
TTM EPS = Net Income TTM / Shares Outstanding
TTM EPS = $21,413 / 504 = $42.49 per share
The above is a great example of calculating TTM and how it is best to find the latest numbers for our analysis.
There are numerous forms of calculations to find the data, but it is best to access the fewest number of filings, reducing my chances of screwing up!
The bottom line is to use whatever pattern works best for you and stick with it; the configuration doesn’t matter as long as you are using numbers from the last twelve months.
Uses of TTM in Finance
Using the TTM figures effectively analyzes the most recent financial information regarding a company in an annualized way.
Annualized information is important because it helps smooth out seasonality impacts and dilutes non-recurring revenues or expenses, such as temporary changes in revenues, cash flows, or expenses.
We can use the TTM calculations across any metric or line item you wish to analyze, such as:
Revenues |
Earnings |
Free Cash Flow |
Margins, i.e., gross, operating, and net |
Working Capital |
As analysts and investors, we can monitor the above metrics, which can help us understand how our company is doing at any given time in the year and allow us to compare apples to apples.
Looking at the TTM, we can smooth out the seasonal or non-recurring impacts and better view Amazon’s continuous performance.
For example, if we look at the comparison of Amazon’s TTM net income compared to the latest annual report:
- 2019 10-k net income – $11,588
- TTM 2020 Q3 net income – $17,377
In and of itself, that doesn’t tell us much, other than the company appears to have grown its net income, but if we look at the earnings per share, we can get a better idea.
- 2019 10-k earnings per share – $23.01
- TTM 2020 Q3 earnings per share – $34.15
As we can see, there was earnings growth in that period, and the company also diluted its shares; in other words, it increased its share count, which should lower earnings, but the earnings grew.
When analyzing financials, all publicly traded companies financial results are only released quarterly per the SEC and GAAP (generally accepted accounting principles).
Companies submit the fillings approximately 30 days after a financial period, depending on each document’s release scheduling.
These financial documents allow the reporting of trailing twelve-month metrics or ratios. However, they are not required, as the financials, such as the income statement, are updated quarterly.
The bonus of using TTM numbers is that analysts can see how the company performs annually without waiting for the annual report filing.
Using the TTM for single line items, we can build models that calculate these numbers for every income statement line item.
Building these models allows us to see a complete picture of the company at any given point in the year. It is a great way to value companies, compare their growth, and see the progress of any leadership initiatives.
As investors, we always want the most recent information to analyze, value, and determine whether an investment is a good one at this time.
Remember that SEC filings only report quarterly or annual financial results rather than the TTM. However, some companies report the TTM numbers in company talks or notes, as GAAP accounting rules do not strictly regulate those areas.
Also, the quarterly or 10-q reports are not GAAP audited, so there is some flexibility.
Final Thoughts
As investors, accessing the latest and greatest data helps us make better decisions. And the use of financial filings such as the income statement should be our first resource. Sometimes, waiting for the next filing is not a choice, and analyzing a company mid-year means we need to either update info or guess.
A better way remains using the TTM numbers, which you can calculate using a mix of annual and quarterly reports. And always ensure we use twelve-month numbers or four quarters’ worth of financials.
Along with using the SEC documents, you can cheat if it is quicker and easier to use your favorite financial website, such as:
Both provide up-to-date TTM numbers across all line items, which is extremely helpful in calculating TTM cash flows or net incomes.
We will wrap up our discussion on TTM finance and how we calculate our numbers.
Thank you for reading this post, and I hope you found something of value on your investing journey. If I can further assist, please don’t hesitate to reach out.
Until next time, take care and be safe out there,
Dave

Dave Ahern
Dave, a self-taught investor, empowers investors to start investing by demystifying the stock market.
