Most companies find growth by retaining earnings (capital) in the business and reinvesting it for sustainable future returns. Using the retention ratio formula can help you project a company’s future growth potential by looking at how much the company can retain in the business.
There are two main types of retention ratios which are used to project future growth. Their formulas are:
- Retention Ratio = (1- Dividend/EPS)
- Retention Ratio = (Capex – Depreciation + Working Capital Investments) / NOPAT
Both formulas have similarities in that they compare an efficiency, or return on capital formula, with how much capital a company retains in the business.
The definitions of profitability and capital retained can differ depending on if you’re focusing on Profits and Losses or cash flows; these are the two primary differences of the two types of retention ratios.
The EPS retention ratio relies only on the Income Statement, while the NOPAT retention ratio also ties in a company’s Cash Flow Statement—which is a more accurate description of a company’s true capital needs for reinvestment.
Both types of retention ratios can be used to project future growth with this formula:
Future growth projection=
= Return on Capital * Retention Rate
= ROE * Retention Ratio with EPS
Or,
= Return on Capital * Retention Rate
= ROIC * Retention Ratio with NOPAT
Basically, a company’s future growth will depend on how much they reinvest and what return they can earn on that reinvestment.
What makes this formula tricky to use in the real world is that returns on reinvestments are not locked over time. Return on capital is fluid and usually changes every year. Each reinvestment can have a different rate of return each year, and previous years’ return on reinvestments can also change over time.
That said, the retention ratio formula for projecting future growth can be a great shortcut tool for making a reasonable estimate about the future—at least for setting a base rate on your growth estimate so you’re somewhere in the ballpark.
Let’s do a few examples of using the retention rate on real companies today.
The EPS Retention Ratio Formula
This formula works particularly well on companies who disperse most of their cash flows back to investors in dividends (instead of buybacks).
There are some weaknesses with this formula just like any other; for example, ROE is widely known to be able to manipulated by a company adding significant debt to drive down Shareholder’s Equity and simultaneously boost Net Income.
But this formula can be useful if you use it in the right context, particularly for companies whose ROEs have been stable over time and those who mostly pay dividends instead of buyback shares.
For this example I’m going to use Paychex ($PAYX).
This is a company which is very capital light, meaning it doesn’t need much reinvestment to grow. This makes sense because they are a payroll company, who simply needs to find clients and maintain a small staff to manage the payroll paperwork of their clients.
Looking at their latest cash flow statement, I can see that they earned roughly $1,145 million in Free Cash Flow (FCFE) for Fiscal Year 2021, and used $156 million of that to buyback shares while paying $909 million of that in dividends.
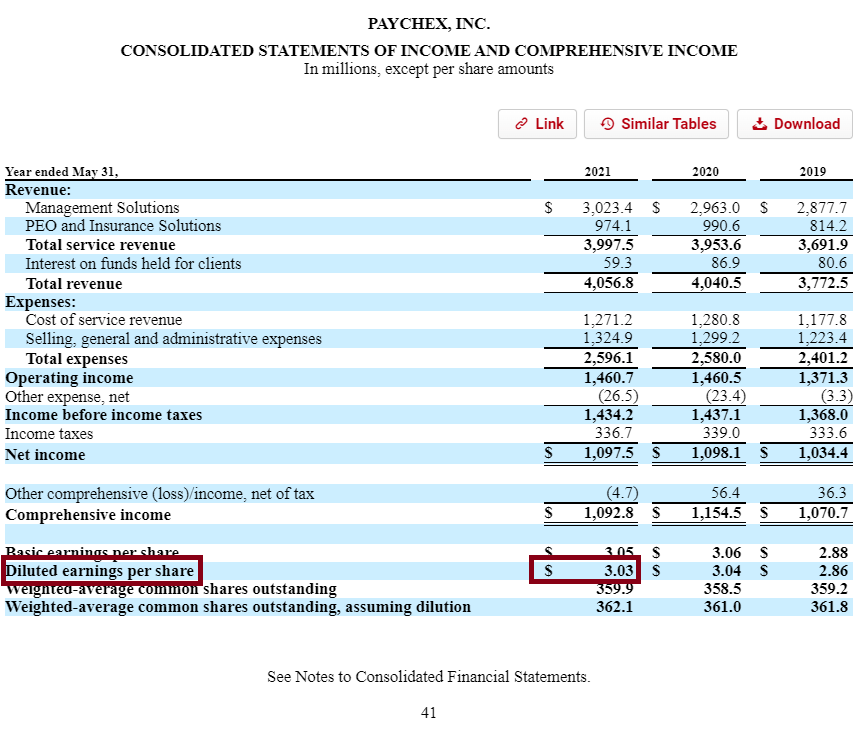
Let’s go to their income statement to find EPS (Earnings Per Share) and Dividends paid. I like using BamSEC for quickly finding a company’s 10-k, here’s from PAYX’s:
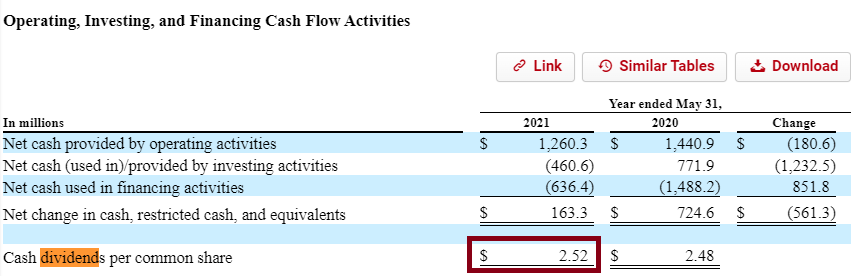
Since the company doesn’t disclose their dividends in the Income Statement, we’ll have to search through the 10-k to find it. In this case, I used “ctrl+f” to search for “dividends”, and found the amount here:
Now that we have the two inputs we can easily calculate the retention ratio formula for EPS.
Retention Ratio =
= (1 – Dividends/EPS)
= (1 – (2.52/3.03))
= (1 – 0.83)
= 0.17, or 17%
You might astutely realize that the retention ratio is simply the inverse of a company’s Payout Ratio, where the payout ratio for Paychex is 0.83 and the retention of 0.17 is simply the other side of that.
Now that we know how much the company has retained in the business, we can use it to estimate future growth.
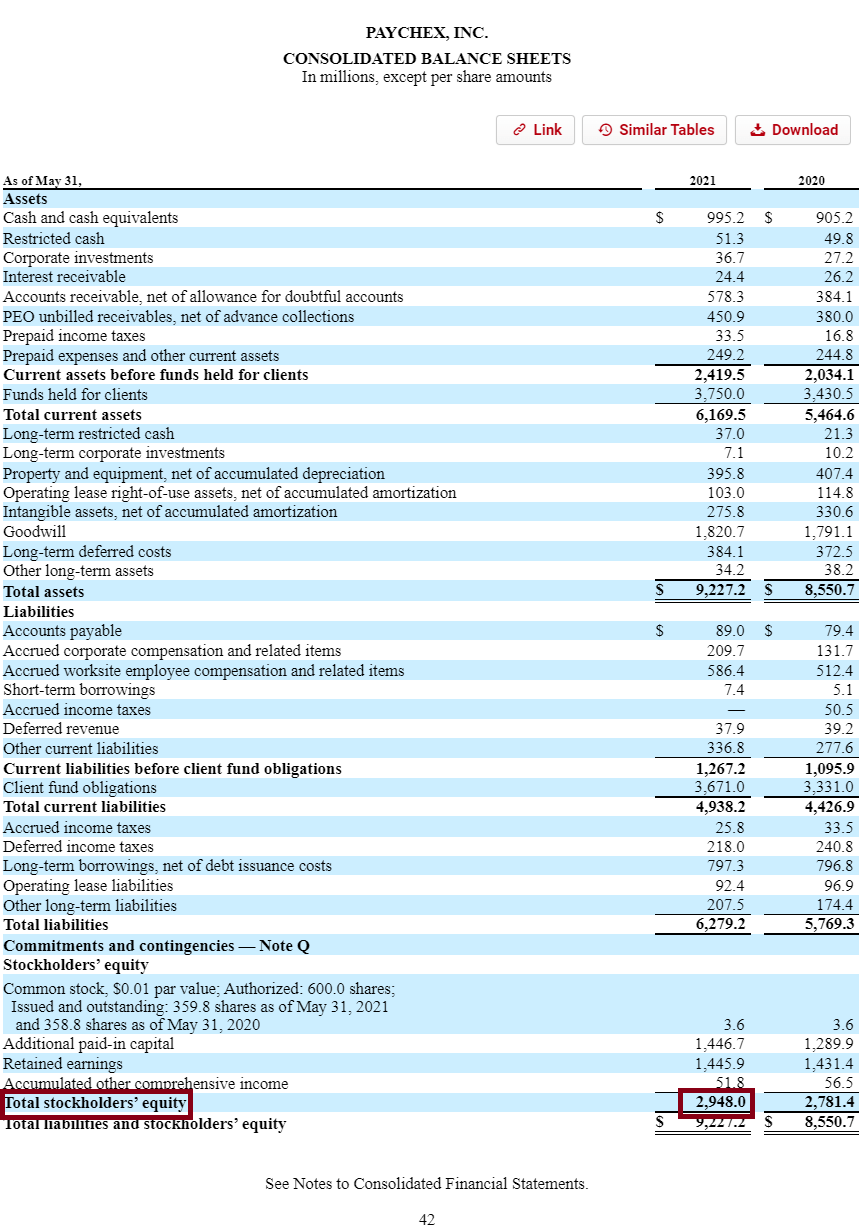
In this case, we’ll need the ROE (Return on Equity). ROE is just Net Income / Shareholder’s Equity. Using the Income Statement again combined with the balance sheet, we can find both and calculate it:
Return on Equity=
= Net Income/ Shareholder’s Equity
=1097.5/2,948.0
=37.2%
Combining the ROE with the EPS Retention Ratio, we get the following for a sustainable growth rate estimate:
Future growth=
= Retention Ratio * ROE
= 17% * 37.2%
= 6.3%
This 6.3% serves as a great base rate on future EPS. That’s not to say that the company can’t earn a higher growth rate, either through buying back shares aggressively, improving margins, or simply seeing boosts in revenue growth for factors outside of reinvestment.
But, it does serve to ground our growth estimates a little bit.
Could we say that the company could grow at 6%, 7%, 8%, or even 10%? I think that’s reasonable when you compare how efficient they’ve been with their capital historically.
But would it be reasonable to say that the company could grow at 15% or 20% moving forward, even if they’ve done so in the past? That’s a harder pill to swallow, especially since that would imply the company’s ROE increasing to 60%+ in the future.
The simple math behind the retention ratio should ground your expectations on company growth rates, especially in your valuation estimates.
There is simply no way for a company to see high growth without drastically increasing their retention ratio or ROE, outside of raising capital through issuing debt or equity. Of course, those methods are not sustainable which is why an EPS retention ratio like this can be valuable.
To be more accurate with your estimates, I recommend taking a retention ratio over multiple years instead of just one.
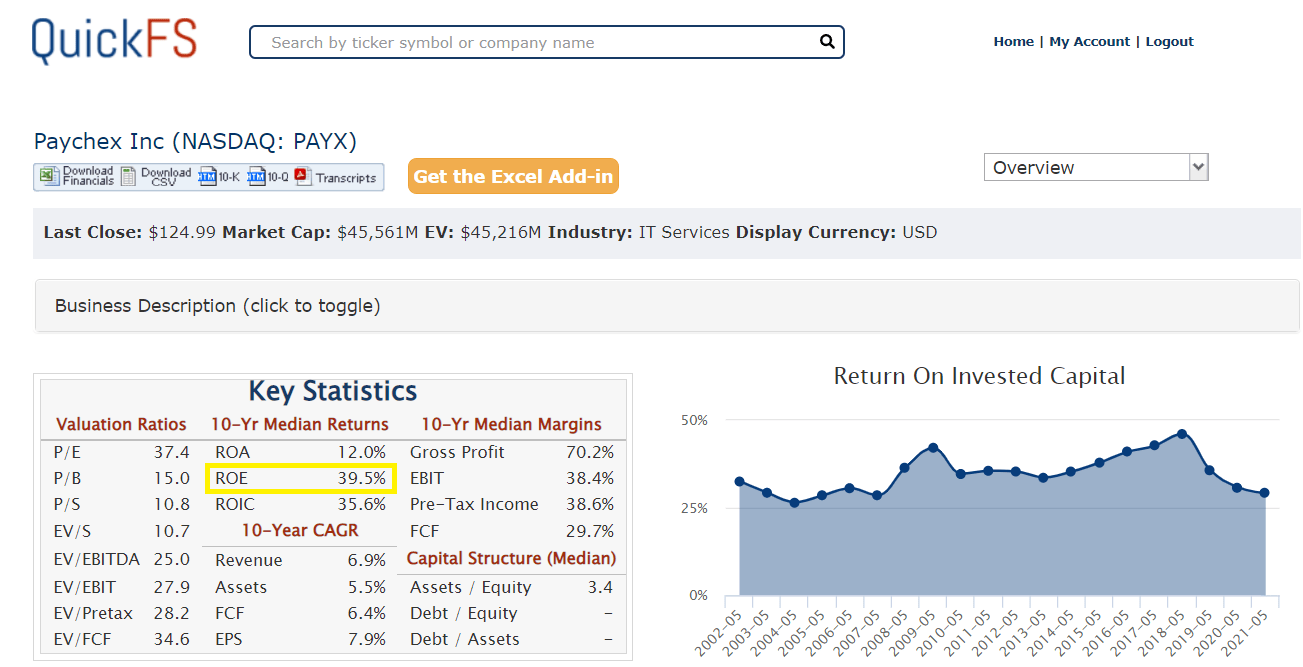
You can use a tool called quickfs.net to quickly look up the company’s historical average for ROE, and also pull up their historical dividend and EPS metrics.
Using a simple 10 year period, I can plug in the following:
Retention Ratio =
= (1 – Sum of Dividends over 10 Years / Sum of EPS over 10 Years)
= (1 – (17.72 / 22.68))
= 0.22, or 22%
And plugging that into our 10 Year median ROE:
Future growth =
= Retention Ratio * ROE
= 22% * 35.6%
= 7.8%
Going back to our Paychex example, we find these growth estimates to be conservative and rational for what we can expect for the future of the business.
Especially when you come across matured companies with established market positions, growth rates will tend to be capped to the growth of a market.
In the case of payroll providers, this ceiling is ultimately capped by corporate profitability. Like I showed in one my older posts on common macroeconomic data, corporate profits in the U.S. have grown at a median of 5.8% over the last 25 years.
All of these numbers seem to point to a growth estimate which is all in the same vicinity, and shows at what growth rate the company’s valuation should probably be estimated at.
There are potential difficulties with using this simple EPS retention ratio on companies however, especially ones who don’t pay a dividend.
But, even those who pay a dividend might see their EPS retention ratio skewed, especially if they return much of their capital back to shareholders through stock buybacks.
The NOPAT Retention Ratio Formula
NOPAT, or Net Operating Profit After Taxes, is a great metric for a variety of reasons but especially because it tends to be a good starting point for calculating a company’s actual free cash flow.
It also ignores the impact of debt on a company’s profitability and cash flows, which has its drawbacks but is very useful in comparing the operating businesses of companies on an apples-to-apples basis. You want this ability because a company might have significant tax breaks from its huge leverage on its balance sheet, for example, which make its cash flows from the operating business appear better than it really is especially compared to a company with no leverage.
To get to the NOPAT Retention Ratio, we first need to get to NOPAT.
The formula for NOPAT is the following:
NOPAT =
= EBIT * (1 – Tax Rate)
EBIT is short for Earnings Before Interest and Taxes, and is also called Operating Income. A company might report this figure as Operating Income or as EBIT on their Income Statement, so it’s important you recognize both of them.
Once you have the NOPAT, you can calculate the Retention Rate by identifying the company’s capital reinvestments for growth. Those are called “Changes in Working Capital” (ΔWC) in the financial statements and “Capital Expenditures” (or capex).
Retention Ratio =
= (Capex – Depreciation + WC Investments) / NOPAT
Note that depreciation is excluded because it represents charges against previous capital investments and not to what extent the company is currently reinvesting capital.
To do this next example we will use Visa ($V).
They are a good example because although they pay out a lot in dividends, $2.8B in 2021, they payout even more through share repurchases ($8.8B in 2021).
Let’s get the NOPAT calculation done first; from the company’s 10-k we can find EBIT:

And their effective tax rate:
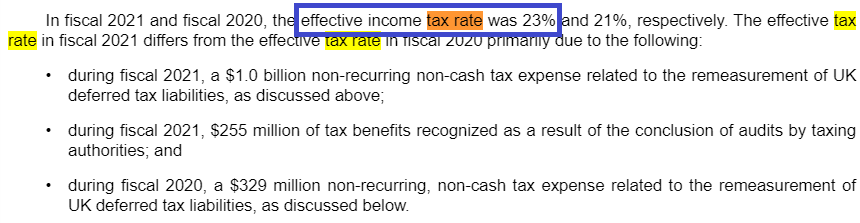
NOPAT =
= 15,804 * (1 – 0.23)
= 12,169.08
= $12,169.08 million
Now we can estimate the NOPAT retention ratio, using the cash flow statement to find capex, changes in working capital, and depreciation:
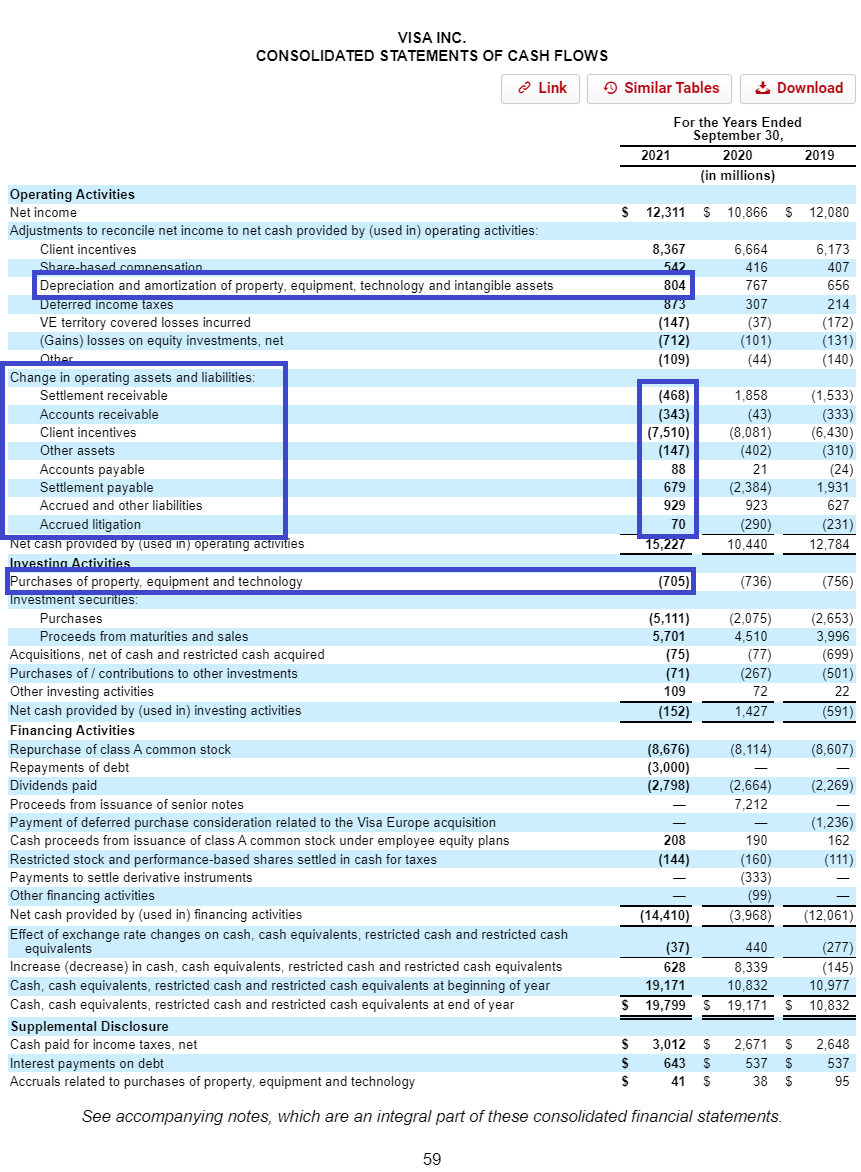
Changes in Working Capital =
= -468 – 343 – 7,510 – 147 + 88 +679 +929 +70
= -6,702
VERY IMPORTANT: Because Working Capital Investments are the cash flows taken out of operations in order to fund the growth of the business, we must take Changes in Working Capital and multiply it by -1 to get Investments in Working Capital.
If a company has a positive changes in working capital, especially if over multi-year periods, this means that the company generally doesn’t have to invest cash flows into working capital to grow but instead receives cash flows on its working capital (sort of like a free “float”).
Investments in Working Capital =
= -1 * Changes in Working Capital
= 6,702
Retention Ratio =
= (705 – 804 + 6,702) / 12,169.08
= 0.54 or 54%
Next let’s project a future growth rate for Visa using this retention ratio and their Long Term ROIC (Return on Invested Capital). Taking their 10 Year Median ROIC from quickfs.net:
Future Growth =
= Retention Ratio * ROIC
= 54% * 19.7%
= 10.6%
Looking at the company’s historical growth rate and comparing it to this projected future growth rate, we see similarities not unlike the above example with Paychex.
With a 10 year median revenue growth of 11%, it might not be that unreasonable to project a growth rate of 10.6% on the company’s future cash flows since it is in the ballpark of both its historical norms in revenue growth and sustainable growth using a NOPAT retention ratio.
Of course, this is dependent on the company’s ability to maintain the same competitive position that it has achieved over the last 10 years, which is an additional consideration to make on any company whose future growth potential you are analyzing.
For thoughts on that, I highly recommend Dave’s post about competitive advantage, and also implore you to consider some of our thoughts on ROIC and how that metric can be a great indicator of the presence of a great competitive moat (we have many posts about ROIC on the blog, just search them in the search bar above).
Also, there are some great additional resources about reinvestment rates and their effect on projecting growth, which I used to help me write this article. Check these out as well:
- Return on Capital (ROC), Return on Invested Capital (ROIC) and Return on Equity (ROE): Measurement and Implications
- Calculating Growth: Internal Growth Rate vs Sustainable Growth Rate
- How to Use Reinvestment Rate to Project Growth for Valuation
I hope these two examples using Paychex and Visa help give you two additional tools to use under your belt as you consider growth estimates for valuation, and how you can use past financials to try and project future growth.
