One of the hardest things to do for a new investor is to understand the math in investing and what some of the different valuation ratios mean. It can be overwhelming but don’t worry, I’m here to help break it down in a very simple way and will even point you to a tool to get you kickstarted on your investing journey!
When you’re looking to value a company, you need to understand the various financials of the company and understand how that company is valued. If you don’t understand some of the basic valuation methods, then it is going to be very, very hard for you to understand why that company is being valued that way as well as if it’s even a good value at all!

Andrew and Dave recently talked about some different valuation ratios on the Investing for Beginners Podcast, all of which I think are key staples for any investor to understand, so let’s break them down a bit further!
Valuation Ratio #1 – Price/Earnings
This is by far the most common price valuation method that you’re going to see. First, let’s take a look at the formula:
Another way to say this formula is to say Market Cap/Total Earnings or Share Price/EPS (Earnings per share). Price/Earnings, or P/E, is a very simple formula (as are all of these valuation ratios) and essentially is going to tell you the price that you have to pay for every dollar of earnings of the company.
For instance, if the company’s market cap is $1 Billion and their earnings are $100 million, then you simply take $1 billion/$100 million and you get 10.
So, that means that you’re paying a 10 times multiple for the company that you are purchasing. But what does that actually mean? Is 10 good?
Well, as with many things in investing, it depends! If I had to just answer yes or no, I’d say yes. In fact, Benjamin Graham says that he targets a P/E under 15, so 10 is significantly lower than that. But just because the P/E is low doesn’t mean it’s a good buy!
P/E is nothing more than a simple valuation ratio that many people use as an initial look to think about the company and how they’re valued. In today’s world, it seems like P/E matters even less because you have companies like TSLA that don’t have any earnings at all, so that means that they can’t have a P/E as you can’t divide by a negative number…I know, I’m taking you back to math class right now:
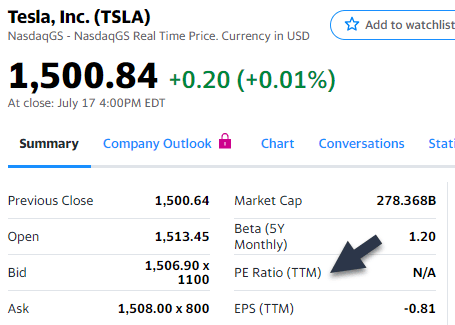
As you can see under the PE Ratio, the EPS is -.81 meaning that every share lost $.81 on average over the Trailing Twelve Months (TTM). But TSLA is at an all-time high because people are buying into the hype rather than the fundamentals!
I do think that this is ridiculous, but I also am starting to loosen my “death grip” on these valuation ratios that somewhat put me in a box. I do think that there are some valuation methods that might be a little bit outdated, or maybe even less pertinent than they used to be, and it’s important to keep with the times, and that leads to my next valuation ratio.
Valuation Ratio #2 – Price/Book
The next ratio is Price/Book, or P/B. Truth be told, this is a ratio that makes a ton of sense to me but just feels a little bit…well…outdated.
Similar to P/E, P/B is a very simple formula to calculate:
We’ve already talked about how “Price” is the market cap of a company so the new thing that we need to find out is the book value. Andrew describes book value as “how much shareholder’s equity is on the books for the business. This doesn’t necessarily equal market value, as various equity/ assets can have different earning power and value.”
In essence, what you’re trying to do with this ratio is to find the value of the assets that the company has currently. The goal behind this is because if the company was forced into bankruptcy and had to liquidate all of their assets then they would be able to sell a certain amount of them off to give some cash back to shareholders.
So, let’s go through a quick example:
If a company has a market cap of $1 billion and their book value is $200 million, then their P/B is 5. That’s great and all, but what is a good P/B?
Well, many people (especially value-investors) try to keep a P/B of 1 or less. Doing so means that the company is currently trading at a price lower than the amount that they could recoup simply by selling their assets.
Nothing else. No more sales or expansion. Just stop and sell everything and you’d have more cash then the market cap of your company.
Honestly, this makes a ton of sense to me, but there is one major issue – it’s outdated! So many companies don’t have great infrastructure. That’s not what makes these newer companies great – it’s their technology. The companies that have typically have a lot of infrastructure which will benefit this ratio.
I’m trying to walk a fine line and not generalize because I do think that there are a lot of great companies that you can find by using the P/B, but I think if you’re using it in your analysis then you’re also going to weed a lot of companies out of your stock screen that are great companies with less of an asset-focused approach.
Valuation Ratio #3 – Price/Sales or Price/Revenue
Personally, this is my favorite of the four valuation strategies. This is a very simple ratio to calculate, just as the two above were, with the change being that you’re simply going to look at the sales/revenue of the company for the valuation:
The reason that I love P/S so much honestly is very similar to the reason that I am not all onboard with P/B – I think that the world is changing. I think that we’re in this weird time where earnings almost don’t matter for companies.
Of course, at the end of the day, businesses are around to make money and that’s essentially the only reason, but I hear me out.
We’re quickly moving into this new world where so many companies are technology companies. I mean, think about it:
- Tesla, who makes cars, is a tech company
- Dominos Pizza, who makes food, is considered tech by many because of their app and delivery platform
- Uber, a glorified taxi service, is pure tech
These companies are taking things that are not technical at all – cars, food and taxis – and turning them into tech-based companies.
Sure, of course we have to apply some sort of valuation to them, and that’s where I like to use P/S. I have no problem with a company shelling out a ton of cash to invest into its platform and become more tech savvy, but that’s going to come at a major cost, likely being lower earnings and hurting their P/E.
And honestly, I don’t think I really care about the company’s assets. I want to see a company that’s willing to spend money on R&D and continue to adapt technologically and keep driving revenues up and up. If that company can continue to grow their sales and they have a path to profitability, then I might be willing to take a flier on that company.
Personally, I think that by benchmarking a company based off their sales, I can likely find a way to make more money than if I was strictly looking at just value. I know that this goes against everything that value-investors think and feel, and even against my own thoughts, but I think that by doing this and even playing a bit of a momentum investing game by preying off the behavioral finance tendencies of others, I can make some rapid gains.
Now, many people will look for a P/S of 1, or maybe a max of 2, but I again might be willing to flex this out a bit if I 1000% am onboard with the company and where I think they’re going.
As I mentioned, when I do this, it’s definitely more of speculation rather than investing, so I make sure to spend even more time researching the company to be sure that I am happy with the risk that I am accepting prior to investing.
I still will really only focus on the long-term (for the most part) because the data shows that the long-term puts the pounding on those short-term investors…looking at you Davey Day Trader!
Valuation Ratio #4 – PEG Ratio
The last ratio that I want to talk about is the PEG Ratio. I really don’t want to spend a ton of time on the details of this because Dave wrote an article that’s 100 times better than I could explain PEG, but essentially you’re taking that same P/E ratio that I described above and then applying it to a growth rate of historical earnings.
So, if the P/E is 20, and the earnings growth rate is 10%, then the PEG ratio is 2 (20/10). The goal is to have a PEG at 1 or less because that would mean that the company’s share price/market cap is growing slower than they are growing their earnings, meaning that they’re actually becoming more and more undervalued by the second!
Andrew, being the incredible person that he is, created a historical look at a ton of companies and compared their returns based off how their PEG ratios were from 2000 – 2018. For instance, take a look below:
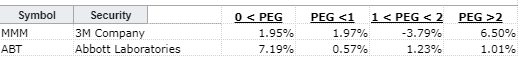
What this means is that when 3M, who is one of the GOAT dividend payers and a Dividend King at that, has a PEG that’s less than 0, the average return was 1.95%. Anything under 1 meant a return of 1.97%. between 1 and 2 was a negative return of -3.79% but then a PEG over 2 was 6.5%!
Based solely on doing a quick scan of Andrew’s (free) sheet, I think that this is likely uncommon and the lower the PEG, the higher the returns will be, which makes a lot of sense because the company is undervalued!
Summary
So, let’s tie it altogether – all four of these valuation ratios are great tools to evaluate a company but it’s also imperative to understand the difference of the company that you’re looking at. For instance, a tech company won’t have the same P/B as a railroad or an oil company might. A new company that’s fresh off their IPO might have a much higher P/S than a Dividend King that has been in business for 50+ years.
Make sure that you’re comparing apples-to-apples and looking at peers when you’re doing your analysis.
Just for fun, I decided to run a stock screener on finviz with the following criteria:
- P/E < 15
- P/B < 1
- P/S < 1
- PEG < 1
Believe it or not, there are 70 companies that meet this very strict criteria!
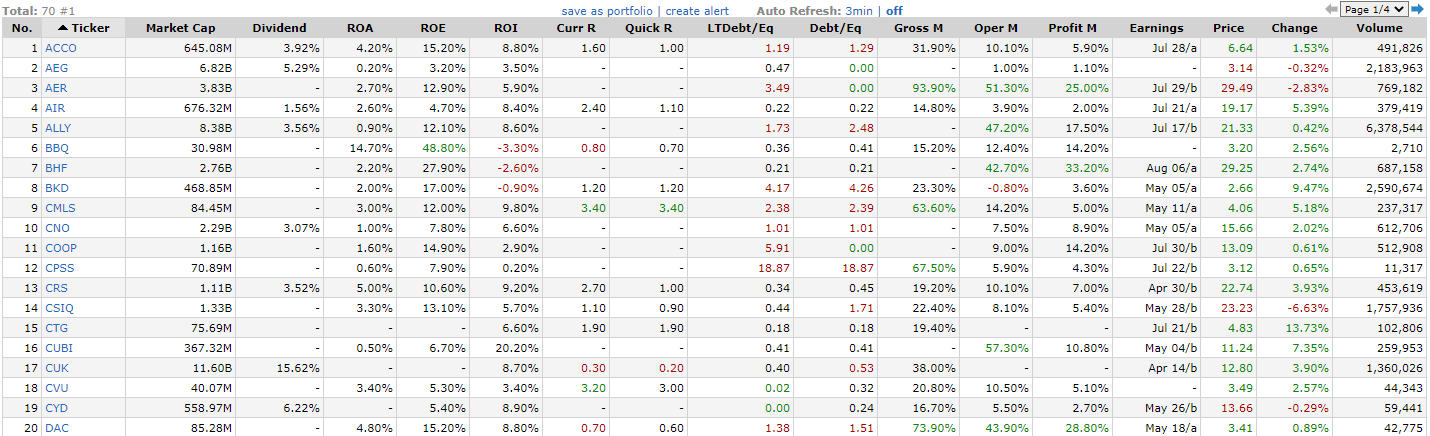
Click to zoomI mean, I just change the P/E to be ‘under 5’ and there were even 36 companies that met that criteria!
I started looking at them and honestly, there was a lot of penny stocks lol, but I still think that these results were very interesting and quite possible a good thing to take a look at further!
At the end of the day, if you’re a new investor, I really recommend that you try to understand these four ratios. To me, I started with these four and they formed a great basis for me and my investing knowledge.
I feel like if you can understand these methods at first, then you’re giving yourself a great foundation of market cap, earnings, book value, sales and growth. Those are all extremely important parts to be a successful investor.
Once you have those mastered, then you can start to move on to some different financials that are worth paying attention to such as the quick/current ratios for short-term liquidity and identifying companies with great management by using ROIC, but only once you’ve mastered these four first!
If you skip these methods, you’re simply robbing yourself! Take the time and learn the right way!
