Walmart 10Q Summary for First Quarter 2020
Walmart reported first-quarter earnings on May 19, 2020. What follows is a summary of the quarterly results for Walmart and includes a discounted cash flow valuation to give you an idea of a price target based on the most current information. No opinions will be offered, just the facts as reported by the company.
Numbers for the Quarter:
- Current Market Cap – $351.21 Billion
- Enterprise Value – $417.58 Billion
- PE GAAP – 23.57
- Price to Book – 5.14
- EV/Sales – 0.78
- Return on Equity – 20.63%
- Return on Assets – 5.83%
Overview of the Quarters Results
Walmart reported that U.S. comp sales were up 10% for the quarter, and the eCommerce sales grew 74%.
Walmart also reported first-quarter GAAP earnings per share of $1.40, with adjusted earnings of $1.18. Along with that, the company also reported incremental costs as a result of Covid-19 of nearly $900 million.
Walmart U.S. Quarterly Financial Highlights
Sales
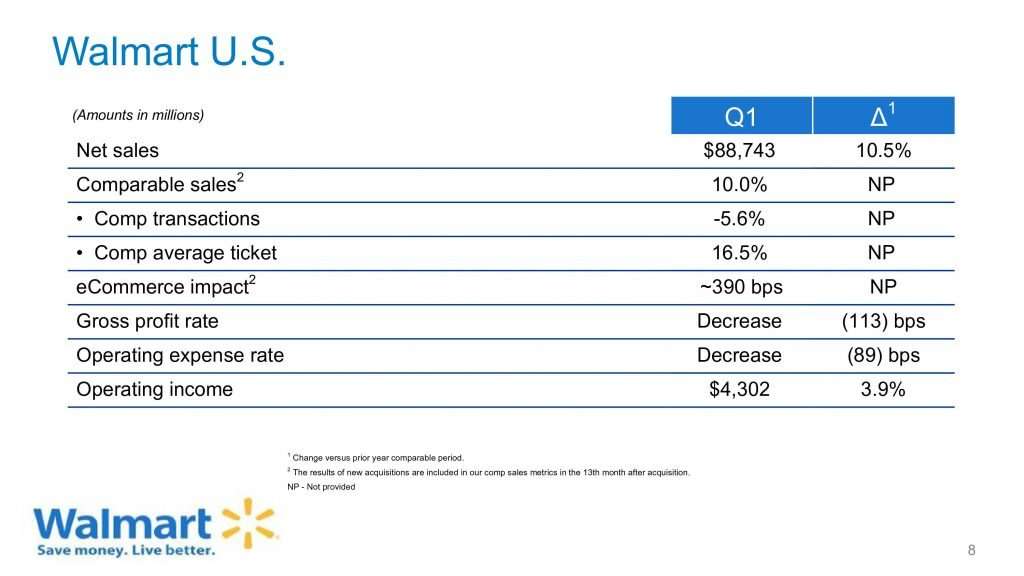
Chart courtesy of Walmart Quarterly Presentation
Walmarts comp sales increased ten percent for the first quarter, with the comp ticket higher by 16.5 percent, while comp transactions fell by 5.6%.
Walmart attributes much of the increases as a result of the Coronavirus pandemic and the stay-at-home orders. As a result, Walmart observed consolidated shopping trips and larger average baskets and a shift more towards eCommerce.
E-commerce saw strong sales growing at 74%, which contributed 390 points approximately to the segment growth comp. Store pickup and delivery, ship to home, ship from store, and marketplace channels were all strong throughout the quarter. Again the growth could be directly tied to Covid-19 and consumer’s reactions to changes in the workplace and home restrictions.
On month by month basis for the quarter, February saw comp sales grow by 3.8 percent. By mid-March, Walmart saw stock up trips surge, which increased March comp sales by 15.4 percent. In April, store sales slowed the first half of the month but picked up by the middle of the month as government surplus checks started arriving, all of which contributed to a 9.5 percent increase in sales comp.
All in all, Walmart saw strength across all U.S. segments, particularly in food, health & wellness, and consumables. The only segment that saw decreases were discretionary areas like apparel.
Gross Profit Rate
Walmart saw a decrease in the gross profit rate of 113 basis points as a result of carryover from last year’s price investments. There was also a crisis-related switch in sales mix to lower-margin categories. And shifts in channel mix towards eCommerce, general merchandise markdowns, and temporary closings of the Auto and Vision as a result of social distancing guidelines.
Expenses
Walmart’s strong sales contributed to operating expense leverage of 89 basis points despite the increased pressure of approximately $670 million in Covid-19 related costs. Increases in associate investments, wage increases, and increased maintenance costs related to cleaning were all offset by the decrease in marketing, travel, and consulting costs.
Operating Income
Walmart’s operating income was also affected by a decline in Other income as a result of Covid-19 temporary closures of instore tenants and revenue lost as a result of the closures.
Inventory
Walmart’s inventory declined 6.1 percent as a result of being out of stock in some categories. All a result of the Covid-19 stocking up by consumers.
Format Growth
During the quarter, Walmart closed two Supercenters and one Neighborhood Market and remodeled 80 stores. As of the first quarter, Walmart reported they had nearly 3,300 pickup locations, and 1,850 stores with same-day grocery delivery and Express Delivery was launched.
Walmart International Quarterly Financial Highlights
Sales
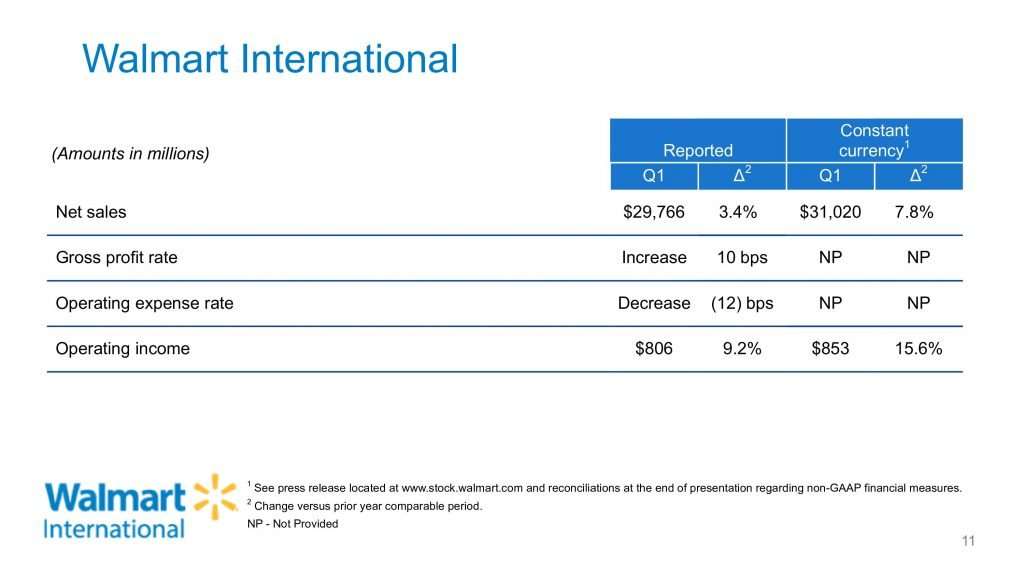
Chart courtesy of Walmart Quarterly Presentation
Walmart reported net sales increased 3.4 percent and increased 7.8 percent on a constant currency basis. Comp sales were positive in 9 out of 10 markets, including the major markets of Canada, Mexico, China, and the U.K. As with the U.S. market, sales were positively impacted as a result of actions taken in response to Covid-19.
All the increases were offset by closures of stores or eCommerce locations in India, South Africa, and South America.
Sales were strong in grocery and consumables, which were offset by weakness in the apparel and general merchandise categories.
Leap Day also was positive on sales to the tune of a 1 percent increase.
E-Commerce was a leader and contributed nine percent to segment sales. The growth was led by Canada, China, the U.K., and Mexico. The limited operations of the company’s Flipkart business in India for part of the quarter was a drag on growth.
Gross Profit
Walmart’s growth profit rate increased by ten basis points for the quarter primarily because of the Flipkart business. All the growth was offset by the change in product mix towards lower margin items and formats as a result of Covid-19.
Expenses
Walmart’s expenses for the quarter leveraged 12 basis points with strong top-line growth and operating discipline. All of which was offset by costs associated with Covid-19.
Operating Income
Operating income for Walmart increased by 9.2 percent and 15.6% in constant currency. The effects of changes in currency rates affected operating income by $47 million negatively. Growth for Walmex and Canada, along with increases from the Flipkart business in India. All of which offset the declines in Asda in China and the U.K.
Inventory
Inventory levels declined 10.6 percent on a quarterly basis, and excluding currency inventory levels remained flat.
Sam’s Club Quarterly Financial Highlights
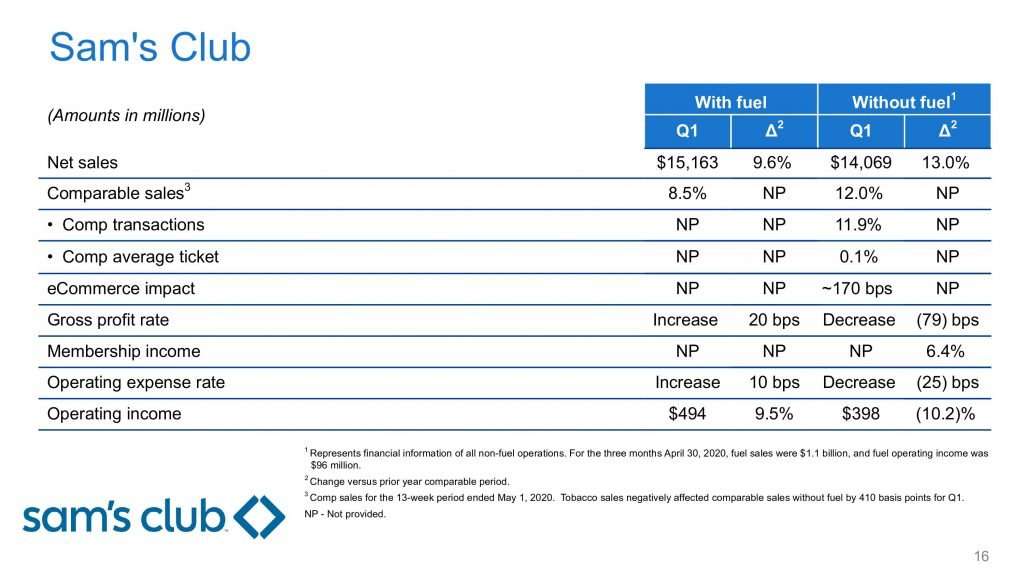
Chart courtesy of Walmart Quarterly Presentation
Sales
Sam’s Club comp sales grew by 12 percent, and comp transactions grew by 11.9 percent with tobacco negatively affecting comp sales by about 410 basis points.
February and March saw strong transactions as a direct result of Covid-19 with consumers stocking up. April conversely saw a dip in traffic as consumers consolidated trips and increased ticket sizes.
Like Walmart, Sam’s Club also saw an increase in grocery, health, and wellness, and consumables, which were offset by decreases in apparel and general merchandise.
eCommerce was again a hit with sales increasing 40 percent, which was driven by strong direct-to-home sales. And Leap Day was a bonus boosting sales by 1 percent.
Gross Profit
Fuel increased the gross profit for Sam’s Club by 20 basis points, and the gross profit decreased by 79 basis points without fuel with higher margins on fuel, affecting gross profit positively. Without fuel in the equation, the gross profit rate declined due to investments in price and fulfillment costs being higher for eCommerce.
Operating Expenses
Operating expenses were affected by fuel, which increased by ten basis points, and when without fuel included, the percentage dropped 25 basis points. Sam’s Club saw lower fuel sales, which negatively affected expense leverage. Operating expense leverage improved in part because of improved labor productivity, but was offset by increases in expenses related to Covid-19 to the tune of $65 billion.
Membership Income
Increases in membership at Sam’s Club rose to 6.4 percent, with trends in membership rates continuing to rise. Comparing total numbers of members, overall renewal rates, and Plus penetration rates all saw increases to last year. Sam’s Club attributes the continued strength to Covid-19.
Inventory
Inventory saw a drop of 13.2 percent, primarily as a result of higher sales volume and the cancelation of the May One Day Event.
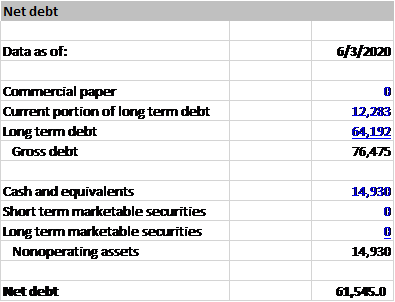
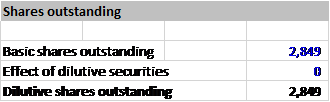
Valuation
The following valuation is a discounted cash model that will attempt to value the company based on the latest known information. I will list out all the parameters so you can follow the inputs, but this is by no means a suggestion to buy or sell shares of Walmart based on the findings. Rather it is a tool to give you an idea of a possible price to build your analysis based on the latest data available. All numbers used are from the trailing twelve months or TTM.
Assuming:
Growth Rate of Free Cash Flow of 10%
Discount Rate of 5%
Terminal Growth Rate of 2%
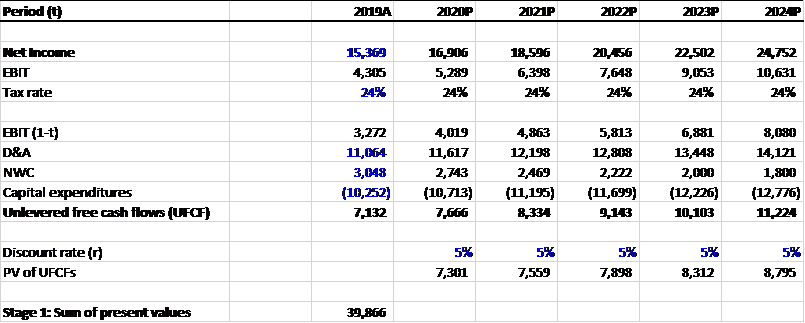
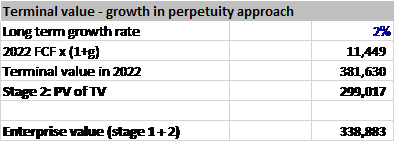
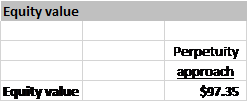
For a range of given values based on discount rates:
4% – $157.96
5% – $97.35
6% – $67.06
Final Thoughts
Thank you for reading through the 10q summary of Walmarts first-quarter results for 2020. No opinions were offered, and the valuation is my attempt to create a possible price target for your analysis of Walmarts results and future growth possibilities.
Take care and be safe out there and happy investing,
Dave
