With inflation now running over 4% in the U.S. and other developed countries, investors are wondering how to classify the seriousness of the situation. As this article will discuss, the two main types of inflation are demand-pull inflation and cost-push inflation.
Both demand-pull inflation and cost-push inflation are likely contributing to the economic environment we are experiencing at the moment.
We will also look at one of the best leading indicators of inflation, the Purchase Managers Index, and what it is saying about future inflation trends.
It is hard to have a conversation about these inflation factors without touching on the dreaded “stagflation” word which is where inflation is rising yet unemployment remains high and economic output is decreasing.
The Two Types of Inflation
Demand-Pull Inflation
When the total demand for an economy’s goods and services increases faster than productivity is able to rise, this causes upward pressure on prices. Due to supply not being able to keep up with the strong demand for goods and services, businesses are able to raise prices without jeopardizing sales.
As can be seen in the graph below where the increase in demand is represented by a rightward shift of the demand curve, this causes a new equilibrium to be reached at a higher price point and a higher level of output (gross domestic product) in the economy.
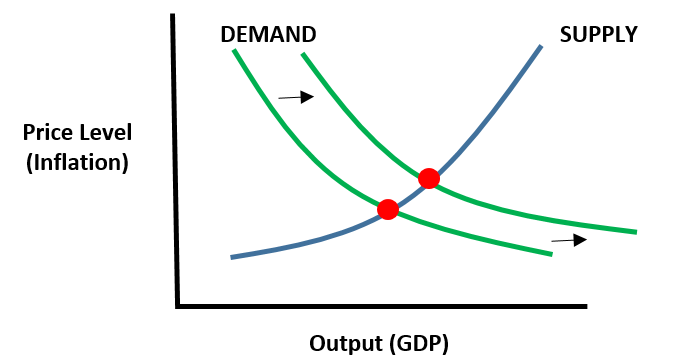
When central banks increase the money supply and governments turn on the fiscal stimulus taps, this increases demand in the economy as consumers have more money to spend. In the short run, businesses cannot increase capacity enough to meet the new demand which causes an upward shift in prices.
The fiscal and monetary stimulus happening now to help aid the COVID recovery is part of what is causing the increase in inflation. This inflation could be said to be due to the increase in demand the government is creating to try and help GDP and employment recover.
Cost-Push Inflation
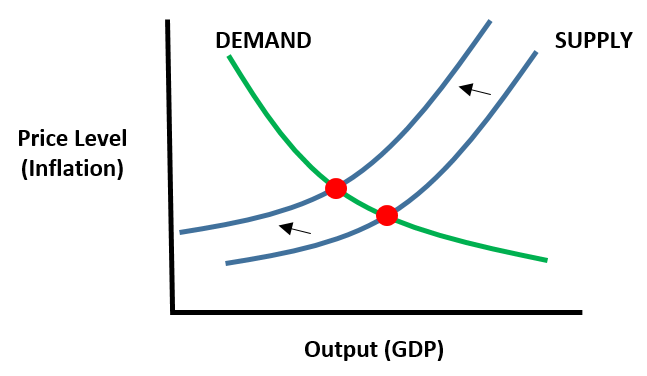
On the other side of the equation comes cost-push inflation, which is caused by rising production costs being passed on to end consumers. Rising costs of production will reduce the amount of supply at any given price point. This is shown by the supply curve shifting left as can be seen in the graph below. This shift of the curve causes a new equilibrium to be found at a higher price point and lower level of output.
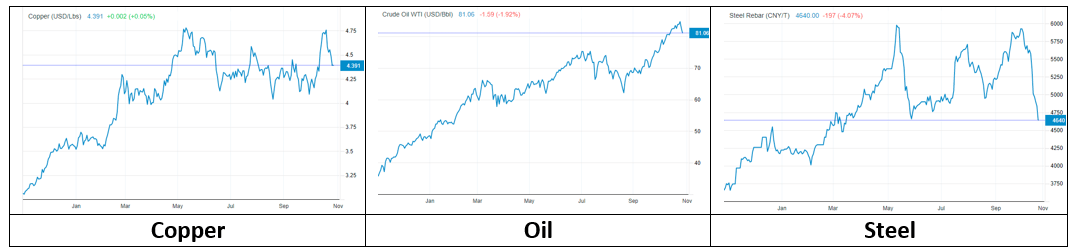
In the economy’s current situation, rising costs of raw materials such as copper, oil, and steel are rippling through supply chains. Certain industries such as the service sector are also seeing pressure on wages as workers are demanding higher salaries in order to return to the workforce, even if capacity and workers hours cuts are happening in the industry. Rising wages and the cost of raw materials will slowly make their way through the value chain and end up in prices seen on grocery store and department store shelves. Personally, I am definitely seeing inflation in the price of my bill at some of my favorite restaurants.
Purchase Managers Index (PMI)
The Purchase Managers Index is one of the best leading indicators of inflation in the economy as its tracks price changes in the production process before they make their way to the end consumer. The PMI is based on a series of answers to questions by purchase managers about their company’s position, including production plans, inventories, prices paid, prices received, and hiring plans.
A reading of 50 is the breakeven point which signals no change in the cost of production while a reading below 50 is associated with declining GDP growth and inflation with readings above 50 are associated with rising GDP and inflation. Right now in the U.S., September’s PMI increased to 61.1 from 59.9 in August which signals more inflation is likely on the way.
What is Stagflation?
Stagflation is the term used to describe an economic situation where inflation is rising but unemployment remains high and economic output is decreasing. There are many theories as to the cause of stagflation, from supply shocks to poor political policy choices, but cost-push inflation tends to be one of the driving factors that can describe both scenarios.
Stagflation is negative to citizens on two fronts. First, people are losing purchasing power due to the rising price level. Second, unemployment is high and the population is losing out on potential wages which further reduces their purchase power, let alone standard of living. The negative situation of stagflation is so unfortunate for citizens that the term “Misery Index” has been created to describe it. The Misery Index is calculated by adding the annual level of inflation with the level of unemployment to add up both these negative effects.
In the cost-push inflation scenario, the solution to the inflationary environment is a rise in productivity which will shift the supply curve back outwards again (to the right) and bring a new equilibrium at a higher level of GDP and lower price point.
Investor Takeaway on Inflation Types
Understanding inflation means being perceptive of demand-pull and cost-push situations in the economic environment. Knowing what the current PMI is signaling is a great way to get a sense of producer prices coming down the value chain towards consumers. Investors who want to understand how inflation can affect their portfolio should continue their exploration with that as well learn about how inflation is present in a DCF model.
