Last week I talked about dividends and specifically tackled the question of “what is a good dividend yield?” While a good dividend yield is extremely important, it can be argued that the payout ratio is even more important.
The payout ratio is rather simple – it’s the ratio of the dividend/share to EPS.
For instance, if the company earned $5/share in a quarter and paid out $.50/share, then the payout ratio would be 10% ($.50/$5 = 10%).
A payout ratio is a fantastic way to tell if a stock’s dividend is growing proportionately. Is the dividend growing at the same rate as earnings? Faster? Slower? Does it matter (yes, it does).
Example: Payout Ratio and Dividend Growth
To explain further, let’s get into the weeds and look at what Apple has done since the start of 2015. Since 2015, Apple has grown their total earnings (not EPS but total earnings) an average of 3% each year. Obviously, growing earnings is a good thing. But, as you can see, quite frequently growing earnings result in a lower payout ratio. See below:
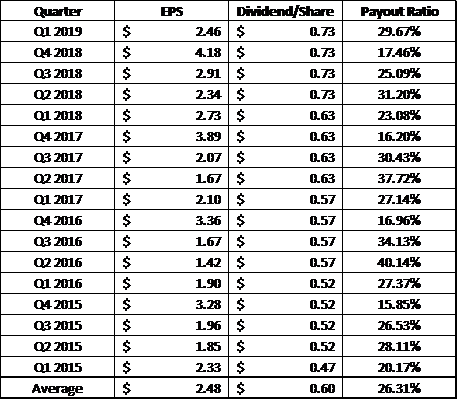
Take a look at the EPS change from Q3 2017 to Q4 2017.
EPS grew from $2.07 to $3.89, or an increase of 88%.
Payout ratio from that same time frame went from 30.43% to 16.20%, or a decrease of 47%.
Note that the dividend stayed the same at $.63/share. If you really understand the payout ratio, this will seem obvious that it dropped. While the dividend stayed the same, EPS dramatically increased, therefore decreasing the percentage of earnings that were given to the shareholders, i.e. the payout ratio.
If you’re only looking at the payout ratio, this might seem like a bad thing, but it obviously is not. The earnings are continuing to grow, and the dividend is as well (on an annual basis).
A contrary way to look at it is that a lower payout ratio means that the company has more room to distribute dividends.
For example, if you bought in now at that lower payout ratio, and the company was dedicated to increase their dividends to accurately portray their earnings, then that would be a great win for you! It would mean that you could ideally anticipate higher earnings growth than what you have seen historically. It really just depends on the company’s philosophy and how you personally look at things.
It is not uncommon for payout ratios to fluctuate dramatically. Below is a year by year look at Apple and their payout ratio fluctuations:

The important thing that I get from this chart is that the payout ratio is pretty steady in the mid-20ish percentile range. I think this is a great payout ratio for a company that’s constantly requiring innovation and R&D like AAPL.
So, the question really is – what is a good payout ratio?
To explain this, I’ll let you inside my brain (only for a short time – it’s a scary place) to understand how I use payout ratio when evaluating companies.
I consider anything under 15% a low payout ratio, and potentially not investable, depending on the reasoning for such a low, or nonexistent, payout ratio.
An average dividend might be in the range of 15-30% or so. This would be the type of payout ratio for a company that is actively reinvesting money back into the business and/or buying stock as it would allow them to maintain 70-85% of earnings for these purposes.
30-50% is very strong in my eyes as you’re getting almost half of the earnings. After all, it is a partnership, right?
50-80% is extremely strong, and you’re reaching Dividend Aristocrat territory here.
And then anything over 80% is my “DANGER, DANGER” territory. This means that the company is paying almost all, or sometimes even more than what they are currently earning. Obviously, this is unsustainable and a major red flag in my eyes.
Average Payout Ratios in the Stock Market (2019)
As I mentioned, 50-80% is really the Dividend Aristocrat territory. As anyone sane person would do (major sarcasm), I went through Yahoo Finance to get most recent payout ratios for all of the 57 Dividend Aristocrats and included them below in order of highest to lowest payout ratio.
The average Dividend Aristocrat is at a payout ratio of 53.17% while the median is 49.67%, so pretty consistent.
All in all – this is probably the target range. Personally, I prefer the 25-50% range to find the lower end Dividend Aristocrats and/or companies that might be purchasing back shares, resulting in lower payout ratios.

Important Final Caveat: Buybacks
Another thing to consider when using payout ratio is that it doesn’t account for share buybacks.
For instance, below I have outlined two different situations where a company doesn’t buyback any shares and then where they do decide to buy back 20% of shares.
Note that the Dividend per share (DPS) doesn’t change at all as dividends are not determined based off a percentage of earnings, so a company could likely reduce their shares but not increase the dividend, therefore not changing the DPS.
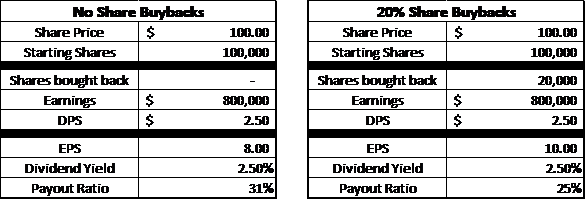
As you can see, the payout ratio looks more attractive when the EPS is lower from not buying back shares, but it really isn’t indicative of being a better value. Does that 6% higher ratio make you think the stock is a better value now? Less value? It really just depends.
If the company bought back the stock at a price that I thought was undervalued, then I’d prefer the lower payout ratio.
If they bought back shares when the stock was already overvalued, then it further confirmed my decision to stay away and I would prefer the higher payout ratio as they shouldn’t be buying back expensive shares.
The key point for this is that payout ratio is a great tool, but similar to all of these ratios that I’ve been writing about – none of them should be the end all, be all. They should simply be one of MANY different variables that you’re looking at when deciphering the value of a stock.
