Recently I have been reading and reviewing the ‘What Works on Wall Street’ book by James O’Shaughnessy and it really has been completely eye opening to me as newer investor.

Quite often we hear people talk about the things that they look for and it usually involves something along the lines of P/E and then looking speculatively about the future opportunities that the company might have.
While I do think that it is important to know the P/E of a company and to look at some of the qualitative factors, like new products or processes that the company has, that is by no means an end all be all.
My first review was on Chapter 10 of the ‘What Works on Wallstreet’ book where O’Shaughnessy talks a lot about the different value factors and which ones are considered best when trying to identify the potential for a future stock. Some of the methods that he strongly recommends are looking for a low Price/Book (P/B), a low Price/Cash Flow (P/CF), or a low Price/Sales (P/S or PSR) ratio.
Essentially, he is just trying to identify a stock that has a low price to some very important financials of the company as book can identify the company’s assets that they have, cash flow is simply just cash which can show the opportunity for them to continue to make investments or be able to make it through tough times, and sales can show you how the company is continuing to grow their revenue stream.
Personally, I am also a big fan of using Price/Sales rather than Price/Earnings because Earnings can be altered by buying back shares of the company, even if done at an inopportune time.
Once you get to Chapter 16 in the book you will get a lesson on how to really use multifactor models to truly analyze a stock in the most effective way possible.
Rather than just looking at P/S, P/B or P/CF like we had discussed, you can combine multiple different ratios and factors to identify a much more selective group of stocks which will not only allow you to find better stocks right off the bat but will also save on the amount of time that you need to spend researching each one.
In this Chapter, O’Shaughnessy provides an example where he takes a P/B of less than 1 and had the best 1-year price appreciation and then also compared them against stocks that have a P/E ratio of under 20 and the best 1-year price appreciation:
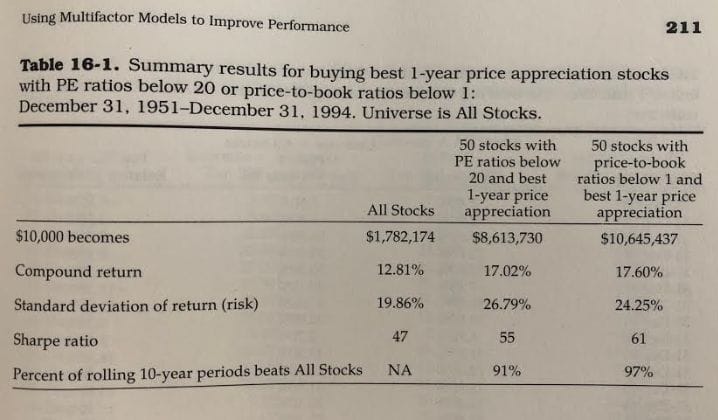
Essentially, he just imagined that he invested $10,000 in 1951 and then compared this investment against looking at all stocks as well as the two other categories that I have mentioned. As you can see, the returns are massive compared to the All Stocks category.
His focus in this chapter is that you can combine these two different pieces of quantitative data to make sure that you can truly find the best set of stocks for you to invest in. From 1951 to 1994, it really is hard to argue with his methodology.
In the last chapter that I reviewed, we really get into the part where O’Shaughnessy takes all of this great information and combines it all together into what he has called the Cornerstone Growth Approach, which contains the following requirements:
- Stocks must come from the All Stocks Universe
- Have EPS that are higher than the previous year
- Have a P/S < 1.5
- Display the best 1-year performance in this All Stocks Group
Personally, I really do agree with the thought process that O’Shaughnessy has, and I think it’s a great methodology. He looks at the sales to show how the products are actually performing to the public and then uses the Cash Flow and the Book value to justify the security of the company.
In my eyes, I really think that this is a well-rounded approach.
The things that I really took away from O’Shaughnessy throughout reading this book is the importance to have financial analysis that you trust and are willing to fall back on.
He spent a ton of time researching and understanding what ratios were key in identifying stocks that really ‘boomed’ or ‘busted’ throughout this 43-year period that he was evaluating. I think it is so important for you to do that as an investor as well.
You need to understand the different factors and ratios to lookout for and you will be a better investor because of that. You might not necessarily agree with his preference of using P/S and you would prefer to use P/E and that is 100% fine!
But the key is that you need to do your own analysis because different things matter to different people.
If I had to summarize my major takeaways from the book I really could do it in just a few bullets:
- Run your own analysis and have faith in that analysis
- Multifactor Models are the best way to find the
best companies
- That being said, do not be afraid to loosen your requirements a bit if you’re using a multifactor model. If you love stocks with a P/E of 15 or less and a P/S of 1, you might miss out on a company that has a P/E of 15 and a P/S of .8, or a P/E of 10 and a P/S of 1.05. Be selective, but not so selective that your list starts out so small and you get frustrated.
- The Cornerstone Growth Approach really has some
great methodology
- I do not believe 100% in all of the things that all investors say by any means, but I do always listen to what they say and if it sparks my interest, I dig in further. I did that with the Cornerstone Growth Approach and I think that a ton of the information really does make a lot of sense. I strongly encourage you to take a look and try to understand why O’Shaughnessy likes these ratios.
And of course, there is no “one size fits all” to investing. Everyone has their own strategy and that’s what makes things fun.
The key is that you need to have your own strategy!
