“Over the long term, it’s hard for a stock to earn a much better return than the business which underlies it earns. If the business earns 6% on capital over 40 years and you hold it for that 40 years, you’re not going to make much different than a 6% return—even if you originally bought it at a huge discount. Conversely, if a business earns 18% on capital over 20 or 30 years, even if you pay an expensive-looking price, you’ll end up with a fine result.”
Working capital makes up most of the company’s investments in growth. The working capital turnover ratio helps investors understand each company’s efficiency.
The better a company uses its working capital, the higher the sales. And all investors want more sales or growth. Using a ratio like this one can help us sort through well-run companies or not.
In today’s post, we will learn:
- What is the Working Capital Turnover Ratio?
- How Do We Calculate the Working Capital Turnover Ratio?
- What is a Good or Bad Working Capital Turnover Ratio?
- Examples of Working Capital Turnover Ratio with Real Companies
Okay, let’s dive in and learn more about the working capital turnover ratio.
What is the Working Capital Turnover Ratio?
A working capital turnover ratio assesses how well a business uses its working capital to promote sales and expansion.
Working capital turnover, also known as net sales to working capital, measures the connection between the company’s resources and sales growth. Companies use those resources to finance their operations, and the revenues the company generates to maintain operations and profit stem from the working capital.
Before moving on, we need to define a few terms.
First, sales equal the annual revenues a company generates easily.
Second, working capital consists of the components a company uses to generate those sales.
Think of items such as:
- Inventory
- Accounts receivable
- Other current assets
- Prepaid expenses
- Accounts payable
- Taxes payable
- Current portion of long-term debt
The easiest way to visualize working capital is to consider the items as current assets minus current liabilities. We can also refer to working capital as net working capital.
Working capital can help us measure a company’s liquidity and short-term health.
A note: a company can carry a negative working capital, meaning current liabilities outweigh current assets. If we see this, it might mean the company needs additional cash to fund operations. It might not mean much in the short term, but if you see a trend, it could mean something bigger.
Positive working capital indicates the company can fund operations from its current operations. It also could show us their ability to fund future growth opportunities.
Remember, a big working capital number might not be a good thing. For example, if Target carries too much inventory and can’t turn the inventory into cash, that’s not great. Or if Amazon buys too much inventory before the holidays and can’t turn over the inventory, also not great.
How Do We Calculate the Working Capital Turnover Ratio?
The working capital turnover ratio compares company revenues to net working capital. As we mentioned earlier, the easiest way to determine working capital is to use the current ratio or subtract the current assets from the current liabilities.
A better way is to look at the net working capital, which offers a more practical measure. The net working capital focuses on only the operating assets and liabilities.

To arrive at the net working capital, we can look at the following:
Non-operating assets – remove any cash and cash equivalents from the current assets.
Non-operating liabilities – remove any debt or interest-bearing securities from the current liabilities.
Let’s compare the working capital and net working capital for Texas Instruments (TXN).
|
Items |
Working Capital |
Net Working Capital |
|
Cash & Investments |
$9,739 |
$0 |
|
Accounts Receivable |
$1,701 |
$1,701 |
|
Inventories |
$1,910 |
$1,910 |
|
Other current assets |
$335 |
$335 |
|
$13,685 |
$3,946 |
Now, we will do the same for current liabilities.
|
Items |
Working Capital |
Net Working Capital |
|
Accounts Payable |
$653 |
$653 |
|
Short-term debt |
$500 |
$0 |
|
Tax Payables |
$121 |
$121 |
|
Other current liabilities |
$1,295 |
$1,295 |
|
Total current liabilities |
$2,569 |
$2,069 |
And now, if we compare the working capital to the net working capital, we get:
|
Item |
Working Capital |
Net Working Capital |
|
Current assets (A) |
$13,685 |
$3,946 |
|
Current liabilities (B) |
$2,569 |
$2,069 |
|
Results (A-B) |
$11,116 |
$1,887 |
As we can see, there is quite a difference. As a company accumulates more cash on its balance sheet, it can distort the working capital of the company.
Granted, some of the cash on the balance sheet fills a need and can act as short-term liquidity, but much of it tends to sit in fixed investments such as bonds.
Let’s put this idea through its paces with an example.
Suppose our business, Andrew’s Golf Lessons, generated $200,000 in revenue last year, and the company’s balance sheet shows the following net working capital items:
- Accounts receivable – $60,000
- Inventory – $80,000
- Accounts payable – $40,000
- Taxes payable – $5,000
Using the numbers above, the net working capital works out as the difference between the current assets and current liabilities, which equals $95,000.
- Net working capital = $60,000 + $80,000 – $40,000 – $5,000
- Net working capital = $95,000
Now we can determine the working capital turnover ratio for Andrew’s Golf Lessons.
Working Capital Turnover = $200,000 ÷ $95,000 = 2.11
The 2.11x turnover ratio we calculated tells us that Andrew’s Golf Lessons generates $2.11 in revenue for every dollar of net working capital employed.
Another term for this type of working capital is non-cash working capital. Professor Aswath Damodaran discusses non-cash working capital in his classes and many articles. Non-cash working capital is a critical part of valuing companies.
The reason for the importance rests in the tying up of cash. Any increases or decreases in working capital will reduce or increase cash flows.
For example, if Texas Instruments buys more inventory, that reduces cash because of the purchase. But if they sell the inventory, that increases cash.
What is a Good or Bad Working Capital Turnover Ratio?
The answers will vary depending on the industry, but a general rule is you want a working capital turnover ratio between 1.2 and 2. But as with anything in finance, it depends.

Some companies operate with high turnover ratios, and others with low, so your analysis will include ideas around what’s good for your company. Also, an asset-light company’s turnover ratio will differ from an asset-heavy company.
A high turnover ratio indicates that management is leveraging the short-term assets and liabilities of the company very well to support sales. In other words, it earns more revenue per dollar of working capital employed.
On the other hand, a low ratio can mean that a company is investing in too much inventory and accounts receivable to cover its sales, which could result in a high number of bad debts or out-of-date inventory.
Analysts can compare a company’s working capital ratio to other businesses in the same industry and consider how the ratio has changed over time to determine how effectively a company uses its working capital.
Such comparisons, however, are useless when working capital goes negative since, at that point, the working capital turnover ratio likewise goes downhill.
Paying attention to cash flow, current assets, and current liabilities continue to play a part of working capital management. We can do this by doing ratio analyses on the main components of operational expenses, such as working capital turnover, collection ratio, and inventory turnover ratio.
The net operating cycle (NOC), often called the cash conversion cycle (CCC), is the shortest time necessary to convert net current assets and liabilities into cash. Working capital management supports maintaining the NOC’s smooth operation. Financial insolvency can happen when a business doesn’t have enough working capital to pay its debts, which can result in legal issues, the liquidation of assets, and even bankruptcy.
Companies employ inventory management to control how effectively they use their working capital and closely monitor their accounts receivable and payments.
The receivable turnover ratio reveals how successfully a firm provides credit and collects debts on that credit, while inventory turnover reveals how frequently a company sells and replaces goods throughout a period.
Examples of Working Capital Turnover Ratio with Real Companies
Okay, let’s look at several working capital turnover ratios using the company’s finances.
The first company I would like to look at is Microsoft (MSFT). I will highlight the items we need from the balance sheet, and all numbers will be in millions unless otherwise stated. The balance sheet we will use comes from 10/25/22.
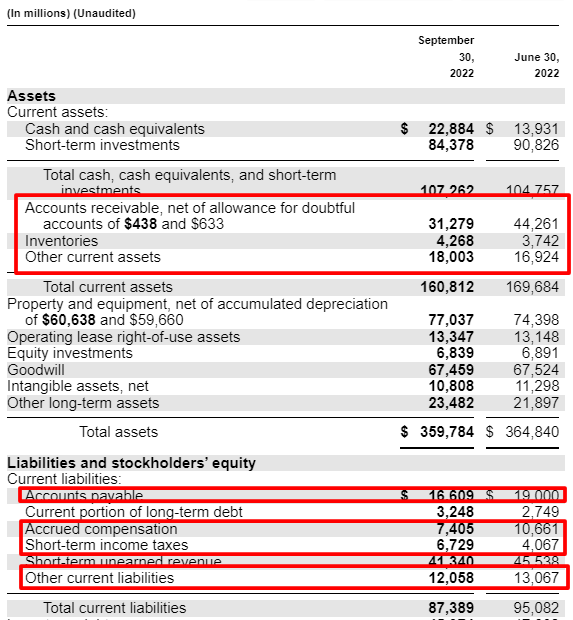
The company’s trailing twelve-month revenues are $203,075 million, and the items for our net working capital equal:
- Accounts receivable = $31,279
- Inventories = $4,268
- Other current assets = $18,003
- Non-cash current assets = $53,550
- Accounts payable = $16,609
- Accrued compensation = $7,405
- Short-term income taxes = $6,729
- Other current liabilities = $12,058
- Non-cash current liabilities = $42,801
Now, we can calculate our non-cash working capital by subtracting the two numbers.
Non-cash working capital = $53,550 – $42,801 = $10,749
To calculate our working capital turnover ratio, we divide Microsoft’s revenue by the non-cash working capital.
Working Capital Turnover ratio = $203,075 ÷ $10,749 = 18.89x
The calculations tell us that Microsoft drives $18.89 for each dollar of working capital.
If we wanted to look at Microsoft’s current assets minus current liabilities, regardless of cash or debt, we see the following:
Working capital = $160,812 – $87,389 = $72,973
Now, we can divide that number by the sales, and we see:
Working Capital Turnover Ratio = $203,075 ÷ $72,973 = 2.78x
The above calculations tell us Microsoft generates $2.78 for each dollar of working capital, including the cash and debt.
The net working capital version of the ratio gives us a good idea relative to the company’s free cash flow, as we use the net working capital to help measure the free cash flow.
The working capital version gives us a good sense of how Microsoft allocates its capital to drive sales. For example, the debt it takes on can help fund more research and development or buy another company to add to its products or services.
If we do the same process with Target (TGT), we see they have a negative net working capital.
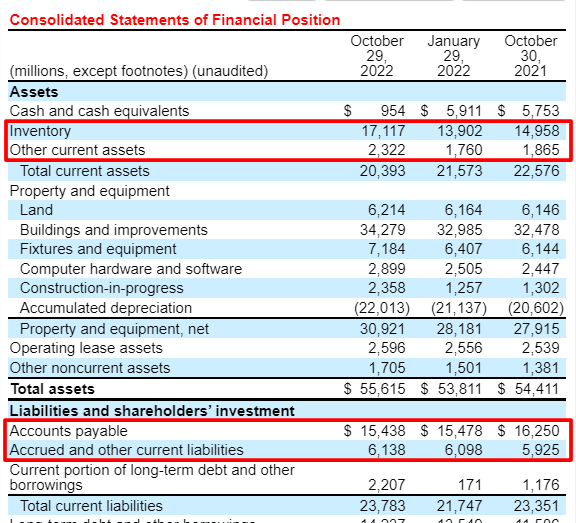
Taking the numbers from the above balance sheet, we see:
- Inventory – $17,117
- Other current assets = $2,322
- Non-cash working capital = $19,439
- Accounts payable = $15,438
- Accrued and other current liabilities = $6,138
- Non-cash current liabilities = $21,576
Then if we take the two numbers, we see the negative result:
Non-cash working capital = $19,439 – $21,576 = -2,137
Therefore, we get a negative working capital turnover ratio, which indicates that Target is not generating revenue from its working capital.
One thing to notice is that Target continues to struggle with over-ordering inventory going into 2022. So if we look at the company’s history and current ratios, we see:
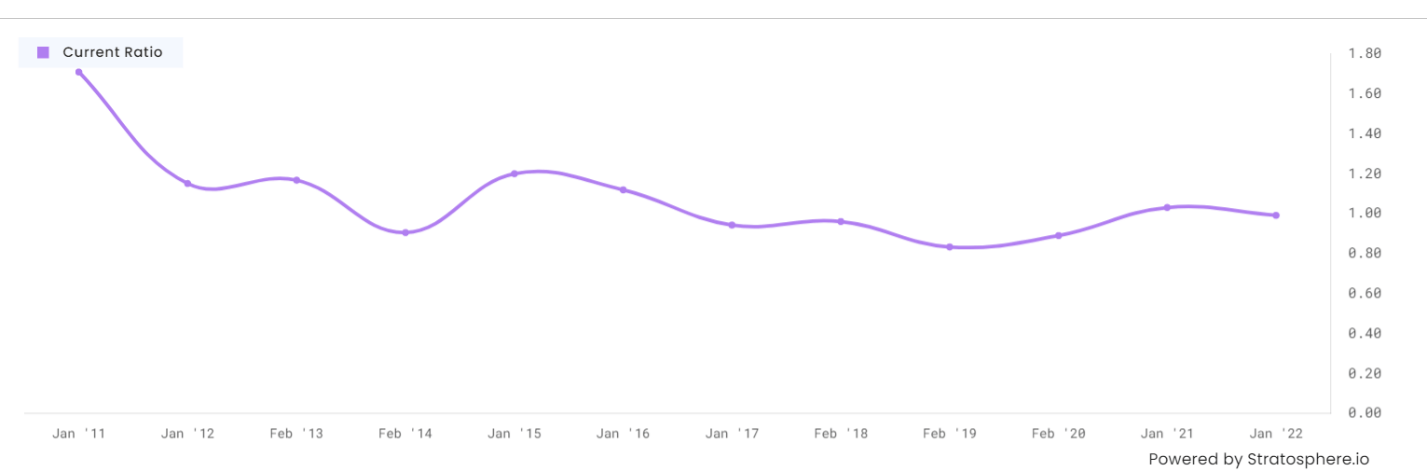
Historically, Target has hovered in the 1.0 to 1.2 range for the current ratio over the last seven years.
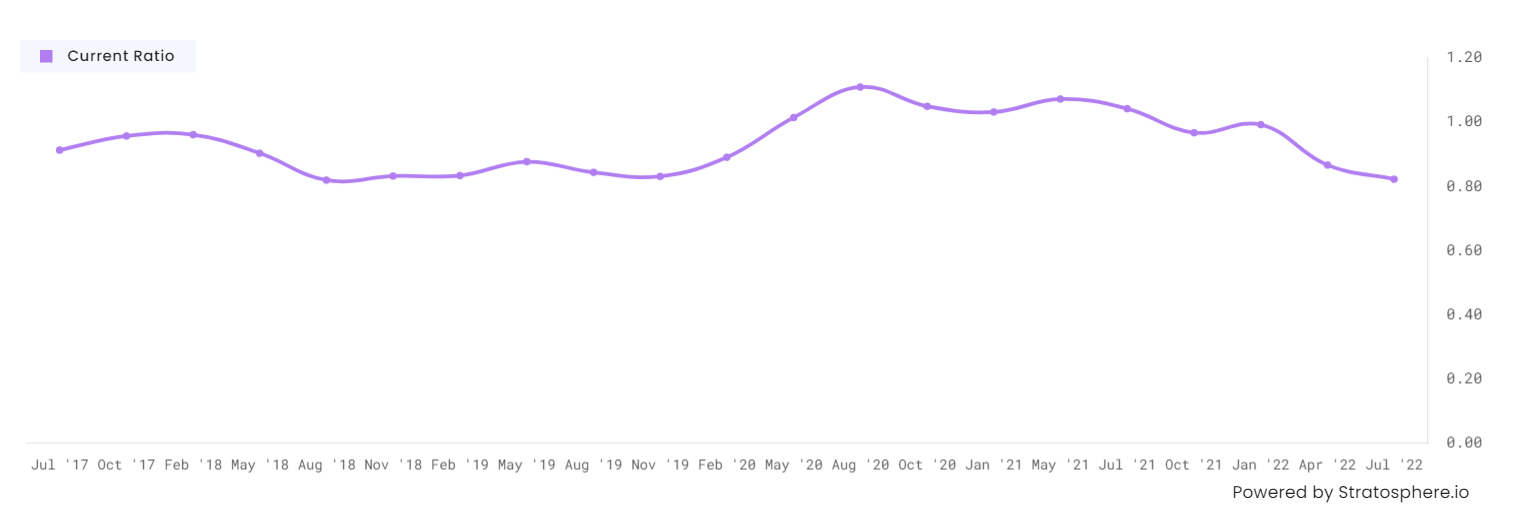
Digging a bit deeper, we can see Target averaged around 1.0 to 1.2 for a current ratio over three years, but in the last three quarters, the number has only dropped from 0.99 to 0.82.
Let’s look at the working capital turnover ratios of a few other companies for reference:
- Walmart = -43.71x
- Google = 8.26x
- 3M = 6.47x
- Old Dominion Freight Line = 13.1x
- Adobe = 16.3x
As we can see from our chart, companies carrying bigger inventories tend towards negative working capital turnover ratios. We saw that Walmart and Target carry negative ratios because the inventory ties up a lot of cash.
Using these types of deeper dives into ratios can help give you better insight into industries and specific companies. Try to always compare across industries or sectors to get better comparisons.
For example, comparing Walmart to Google is not a fair comparison.
Investor Takeaway
A company with a high working capital turnover ratio will likely be doing well and require little extra finance. Regular inflows and outflows of funds allow the company to invest capital in expansion or inventory. As a profitability metric, a high ratio may also give the company an advantage over rival businesses.
A too-high ratio, however, can mean that a company lacks the money to maintain the expansion of its sales. Therefore, the company might soon become insolvent if it doesn’t raise more money to finance that growth.
When a company’s accounts payable are particularly high, which could suggest that the business is having trouble paying its invoices when they become due, the working capital turnover indicator can also deliver deceiving results.
And with that, we will wrap up our conversation regarding the working capital turnover ratio.
Thank you for reading today’s post, and I hope you find some value. If I can be of any further assistance, please don’t hesitate to reach out.
Until next time, take care and be safe out there,
Dave
