Analyzing a bank’s stock requires a multifaceted approach. It focuses on the bank’s financial health, market value, and dividend performance. This analysis can reveal insights about the bank. It covers its efficiency and whether the bank can handle economic ups and downs and provide value to shareholders.
We will equip you with a structured methodology to assess a bank stock comprehensively.
Investors can make informed choices by understanding key financial indicators, valuation metrics, and dividends.
In this article, you will learn:
- Important Bank KPIs to Know
- How to Value a Bank Using Metrics.
- Dividends and Their Impact in Evaluating a Bank Stock
- Real-life Examples Using Nubank
Let’s dive into the specifics of bank stock analysis, starting with the core financial health indicators.
Important Bank KPIs to Know
A thorough analysis of a bank’s financial health is foundational to understanding its overall stability, profitability, and risk profile.

By examining specific financial metrics and ratios, investors can gain insight into a bank’s operational efficiency, asset quality, and financial strength.
Here are the key financial health indicators you should evaluate, including their formulas:
Earnings Reports Analysis
Diving into quarterly and annual earnings reports provides a snapshot of the bank’s financial performance over time. Look for trends in revenue, net income, and operational costs.
Key Financial Ratios
- Return on Equity (ROE)
- Formula: ROE = Net Income / Shareholder’s Equity
- This ratio measures how efficiently a bank uses its equity to generate profits, indicating its profitability.
- Return on Assets (ROA)
- Formula: ROA = Net Income / Total Assets
- ROA shows how effectively the bank uses its assets to generate earnings, reflecting its asset efficiency.
- Net Interest Margin (NIM)
- Formula: NIM = (Interest Income – Interest Expense) / Average Earning Assets
- NIM assesses the difference between the interest income generated and the interest paid out relative to the bank’s earning assets. It’s a measure of the bank’s lending profitability.
- Loan-to-Deposit Ratio (LDR)
- Formula: LDR = Total Loans / Total Deposits
- This ratio evaluates the bank’s liquidity by comparing its total loans and deposits. An optimal LDR indicates that the bank is well-positioned to cover withdrawals.
- Non-Performing Loans (NPL) Ratio
- Formula: NPL Ratio = Non-Performing Loans / Total Loans
- The NPL ratio indicates the level of loans in or near default, highlighting the bank’s loan portfolio riskiness.
- Common Equity Tier 1 (CET1) Ratio
- Formula: CET1 Ratio = Common Equity Tier 1 Capital / Risk-Weighted Assets
- A critical measure from a regulatory perspective, the CET1 ratio compares a bank’s core equity capital (excluding preferred stocks and non-controlling interests) to its total risk-weighted assets. It highlights the bank’s ability to withstand financial stress and comply with regulatory requirements.
- Efficiency Ratio
- Formula: Efficiency Ratio = Non-Interest Expense / (Net Interest Income + Non-Interest Income)
- This ratio measures a bank’s overhead as a percentage of its revenue, indicating its efficiency. A lower efficiency ratio signifies a bank’s ability to generate income with lower operational expenses, thus being more efficient.
Implementation Tips
- Gather Data: Collect the latest financial statements and public disclosures from the bank. Many banks publish their key financial ratios in their quarterly and annual reports.
- Calculate Ratios: Use the provided formulas to calculate each ratio. For a comprehensive analysis, compare these figures over several periods to identify trends.
- Benchmark: Compare the bank’s ratios against industry averages and peers to gauge its performance relative to the competition.
- Interpret Results: Analyze the calculated ratios in the context of the current economic environment, regulatory changes, and the bank’s strategic initiatives.
Understanding these financial health indicators is crucial for assessing a bank’s stock.
They offer insights into the bank’s operational success, financial stability, and potential risks, laying the groundwork for a more informed investment decision. Next, we’ll explore using valuation metrics to assess a bank’s market standing.
How to Value a Bank Using Metrics
Analyzing bank stocks requires carefully examining various financial metrics to determine their valuation and overall financial health.

Because banks produce earnings via the difference between interest rates of lending and savings, they don’t produce “cash flows” in the normal sense.
As such, we need to value banks differently.
Using ratios is a quick and dirty way to do this. Others are more involved, but that is a story for another day.
Among these, the Price-to-Earnings (P/E) ratio and the Price-to-Book (P/B) ratio are particularly important for banks. Here’s how these metrics apply to JPMorgan Chase & Co. ($JPM) and Bank of America ($BAC), including their formulas and significance in banking sector evaluation.
Price-to-Earnings (P/E) Ratio
- Formula: P/E Ratio = Market Price per Share / Earnings per Share (EPS)
- Significance: The P/E ratio indicates how much investors will pay for a dollar of earnings. In the banking sector, it helps assess a bank’s profitability relative to its share price, offering insights into whether a stock might be overvalued or undervalued.
- JPMorgan Chase & Co.: A trailing P/E ratio of 11.30 shows the premium investors are willing to pay for JPM’s earnings.
- Bank of America: A slightly lower trailing P/E ratio of 11.14 suggests BAC might offer a better value per dollar of earnings than JPM.
Price-to-Book (P/B) Ratio
- Formula: P/B Ratio = Market Price per Share / Book Value per Share
- Significance: The P/B ratio compares a company’s market valuation to its book value. For banks, this ratio is particularly relevant due to their asset-intensive nature. It helps investors evaluate whether a bank’s stock is valued appropriately relative to its equity.
- JPMorgan Chase & Co.: The P/B ratio 1.76 indicates that investors pay a 76% premium over JPM’s book value, reflecting its asset quality and market confidence.
- Bank of America: With a P/B ratio of 0.91, BAC’s market price is closer to its book value, potentially signaling undervaluation or more conservative pricing relative to its net assets.
JPMorgan Chase & Co. and Bank of America are pivotal players in the banking sector. But, their valuation metrics highlight key differences in market valuation and investor perception.
Bank of America’s lower P/E and P/B ratios than JPMorgan suggest it might be more attractive, offering potentially better value for investors focused on earnings and book value.
However, understanding why these ratios matter—especially in the context of banks’ asset-heavy balance sheets and earnings potential—is crucial for making informed investment decisions.
These metrics, combined with a comprehensive analysis of financial statements, market conditions, and future growth prospects, provide a solid foundation for evaluating bank stocks.
Dividends and Their Impact in Evaluating a Bank’s Stock
Dividends are a big part of investing, especially in the banking sector. We must include them as part of our expected returns.
But they also offer insights into financial health.
Two critical metrics to understand in the context of dividends are the Dividend Yield and the Dividend Payout Ratio.
Let’s examine these metrics for JPMorgan Chase & Co. and Bank of America, applying their respective formulas and exploring their implications.
Dividend Yield
- Formula: Dividend Yield = Annual Dividends per Share / Price per Share
- Significance: The dividend yield is a financial ratio that shows how much a company pays out in dividends each year relative to its stock price. It’s a measure of the income provided by the stock, making it particularly important for income-focused investors. A stable or growing dividend yield in the banking sector can signify financial health and a commitment to returning value to shareholders.
- JPMorgan Chase & Co.: JPMorgan has a history of providing its shareholders with consistent dividends. As of the most recent data, JPM offers an annual dividend of $4.10 per share, resulting in a dividend yield of approximately 2.44% based on the current stock price.
- Bank of America: Bank of America also provides dividends, with an annual rate of $0.92 per share, leading to a dividend yield of about 2%, indicating a competitive return on investment through dividends compared to JPM.
Dividend Payout Ratio
- Formula: Dividend Payout Ratio = Total Dividends Paid / Net Income
- Significance: This ratio indicates the percentage of earnings a company returns to shareholders as dividends. It’s a key metric for evaluating a company’s ability to maintain its dividend payments. A lower payout ratio might suggest that the company has more room to grow its dividends in the future. In contrast, a higher ratio could indicate limited growth prospects or a strong commitment to returning profits to shareholders.
- JPMorgan Chase & Co.: JPM’s approach to dividends reflects its financial strength and strategy of shareholder value distribution. With a payout ratio of 25.2%, they balance returning income to investors while retaining earnings for growth; JPM shows a prudent management strategy.
- Bank of America: BAC’s dividend payout ratio of 29.7% suggests a similar commitment to returning value to shareholders. The bank offers a relatively high yield while maintaining a payout ratio that supports its dividend policy and growth ambitions.
When comparing JPMorgan Chase & Co. and Bank of America regarding dividends, both banks are committed to returning value to their shareholders through dividends.
Bank of America offers a slightly lower dividend yield than JP Morgan’s, which may reflect its stock price dynamics and earnings distribution strategy.

On the other hand, JP Morgan’s higher dividend yield is attractive for income-seeking investors. Yet, both banks maintain payout ratios that suggest a balanced approach to rewarding shareholders and reinvesting in their operations.
For investors, analyzing dividend yields and payout ratios in the context of the company’s overall financial health and strategic direction is crucial.
These metrics provide insights into the company’s current and future ability to generate income for its shareholders, making them essential tools for evaluating investment opportunities in the banking sector.
Real-life Examples Using Nubank
Now that we have a foundation for analyzing a bank, let’s put one through its paces.
I am choosing to use Nu Holdings or Nubank (NU). Full disclosure: I own shares of Nubank.
So, who is Nubank?
Nubank, established in 2013 in São Paulo, Brazil, by David Vélez, Cristina Junqueira, and Edward Wible, emerged as Latin America’s most significant digital bank.
It disrupted the traditional banking sector by introducing a no-fee credit card, fully managed via a mobile app, aiming to simplify financial services and enhance customer experience. It quickly gained popularity for its user-friendly approach and financial inclusivity.
Now, we will work through each of the three sections from the outline:
- Financial Health
- Valuation
- Dividends
Section three, dividends, will be the easiest for Nubank, as they don’t pay dividends. But we will compare a few others for reference.
Financial Health
Review earnings call:
Here are three key takeaways from Nubank’s latest earnings release:
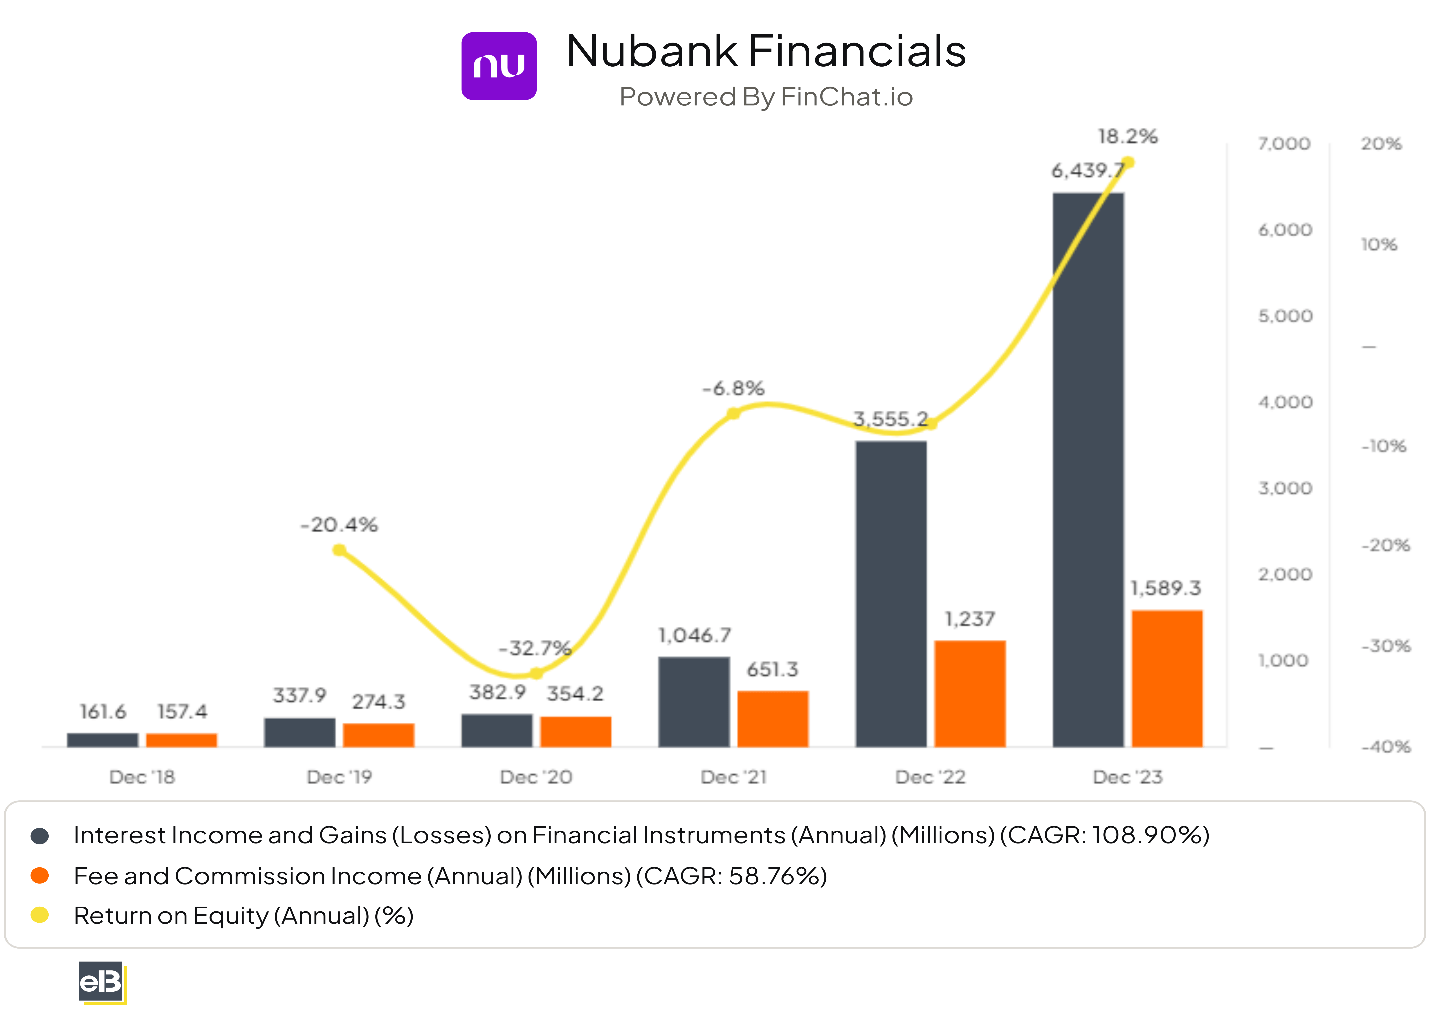
- Significant Profit Growth: Nubank reported a substantial increase in profitability, with net income for Q4’23 reaching $360.9 million, representing an annualized return on equity (ROE) of 23%. For 2023, net income soared to $1.0 billion, a remarkable turnaround from a net loss of $364 million in FY’22. Adjusted net income for Q4’23 was even higher at $395.8 million, demonstrating Nubank’s strong operational performance and strategic investments in product development and geographic expansion.
- Customer Base Expansion: Nubank’s customer-centric approach continues to pay dividends, as evidenced by the addition of 4.8 million customers in the fourth quarter alone, ending 2023 with 93.9 million customers in Latin America. This growth was fueled by strong demand for its core lending products, including credit cards and personal loans.
- Revenue and Gross Profit Increases: The company’s revenue for the quarter surged to $2.4 billion, marking a new record and a 92% increase from the previous year. Net profit also hit a new quarterly record of $360.9 billion, up 87% year-over-year, with a net profit margin expansion to 27%. These figures underscore Nubank’s ability to scale its operations while maintaining profitability.
Financial KPIs
- Return on Equity = $1,030 / $6,406 = 16.1%
- Return on Assets = $1,030 / $43,345 = 2.38%
- Net Interest Margin = ($4,792 – $1,971) / $43,345 = 6.5%
- Loan-to-Deposit Ratio = $9,906 / $15,808 = 62.6%
- Common Tier 1 (CETI) = 24.2%
- Non-Performing Loans = 4.7%
- Efficiency Ratio = $1,971 / ($4,792 – $1,404) = 56.5%
Valuation
- P/E Ratio = $53,090 / $1,030 = 51.5
- P/B Ratio = $53,090 / $6,406 = 8.29
Dividends
Nubank currently doesn’t pay a dividend.
Refer to the above JP Morgan and Bank of America results in the dividend section to understand how they impact the valuation.
Nubank is working towards growth, expanding into Mexico and Columbia while continuing to expand in Brazil. These investments take the majority of their capital. When the bank slows its roll, it will start to pay dividends.
Analysis:
Based on the above figures, we can determine a few things:
Financial health – Nubank continues to grow revenues quickly, expanding into other regions for more growth. Mexico and Columbia provide bigger runways for growth. Nubank’s digital footprint offers better margins and ratios than others in their region.
For example, large incumbents in Brazil:
Itau ROE = 18.2%
Banco do Brazil = 18.45%
Nubank = 23% (most recent quarterly)
Nubank is easily the fastest-growing bank in Latin America, and its digital-first offerings resonate well with its customers. The company has the highest NPR rating in LatAm at 79.
If you work through the financial health metrics for comparables, you see the strength of Nubank’s business model.
As the bank grows in the unbanked region with higher-value customers, its profitability will increase.
Valuation:
There is no question that Nubank is expensive across any metric you choose to use. We can base that on the comparison to others in the same region using the P/E ratio:
- Nubank = 53
- Itau = 10
- Banco do Brasil = 5.51
- Banco Santander = 11.84
If you wanted to invest in Nubank, you would have to factor in the valuation compared to the long growth runway. How much is the continued growth worth?
Investor Takeaways
Throughout this article, we’ve examined three pivotal metrics for assessing bank stocks: financial health, valuation metrics, and dividend analysis, focusing on JPMorgan Chase & Co., Bank of America, and Nubank.
By dissecting these metrics, we hope to provide investors with a comprehensive toolkit for evaluating these banking giants’ financial health and investment potential.
Understanding these metrics is just the beginning for investors contemplating a foray into the banking sector.
A holistic analysis incorporating these valuation and dividend insights, alongside considerations of macroeconomic factors, regulatory environment, and individual bank strategies, will be crucial.
For those looking to deepen their investment analysis, exploring advanced financial models, sector-specific trends, and emerging banking technologies could provide the next strategic edge.
As the financial landscape evolves, staying informed and adaptable will be paramount in navigating the opportunities and challenges within the banking sector.
With that, we will wrap up today’s discussion of bank analysis.
Thank you for reading, and I hope you find something of value. If I can help any further, please don’t hesitate to reach out.
Until next time, take care and be safe out there,
Dave
