Among the many valuation methods and models, an undervalued model, no pun intended, is the earnings power value formula, which helps us find undervalued companies without as much estimating as the discounted cash flows, for example.
Is the earnings power value formula perfect, unfortunately, no. But it is another tool in our valuation toolbox.
Using numbers from all three financial statements, the earnings power value allows you to find the intrinsic value of companies, but the technique ignores growth, which much of Wall Street obsesses around earnings growth. Not that there is anything wrong with growth, that is the only way companies can grow.
But Wall Streets’ fixation on only growth tends to ignore other factors such as fundamentals of the business and those relationships to the continued success of the business.
The earnings power value formula helps us value a company and focus on the fundamentals of the business.
In today’s post, we will learn:
- What is Earnings Power Value?
- The Formula for Earnings Power Value
- How to Calculate Earnings Power Value
- What Does the Earnings Power Value Tell Us?
- Limitations of Earnings Power Value
Ok, let’s dive in and learn about the earnings power value formula.
What is Earnings Power Value?
Here is how my friends at Investopedia describe the earnings power value model:
“Earnings power value (EPV) is a technique for valuing stocks by making assumptions about the sustainability of current earnings and the cost of capital but not future growth. We derive Earnings power value (EPV) by dividing a company’s adjusted earnings by its weighted average cost of capital (WACC).”
The calculations and formula for earnings power value are simple. However, there are numerous steps that we need to follow to arrive at the adjusted earnings and the WACC; what we arrive at after those calculations are the earnings power value equity, which we can compare to the market cap of the company.
So what is earnings power?
Simply, it is the company’s ability to squeeze out every drop of profit it can from the operations of the business. The more efficient a company is, the better they can create more profits from each unit sold.
A little background on the model was created by Bruce Greenwald, who is a professor of economics and investment at Columbia University. He is a well-regarded value investor and has written multiple outstanding books, including one of my favorites, Value Investing: From Graham to Buffett and Beyond.
It is from the above book that I first came upon the earnings power value model.
Greenwald is a little under the radar, and he doesn’t always get the recognition he is due, but he is a fantastic teacher, and he has interesting ways of looking at value investing. Check out his lectures; they are worth your time.
A quote from Greenwald summing up his thoughts on the formula:
“The second most reliable measure of a firm’s intrinsic value is the second calculation made by [Benjamin] Graham and [David] Dodd, namely, the value of its current earnings, properly adjusted. This value can be estimated with more certainty than future earnings or cash flows, and it is more relevant to today’s values than are earnings in the past.”
If you would like to see the lecture that Greenwald uses to explain his model, please follow the link below, the comments on the EPV start on slide 16:
A note about the link above, it does require a subscription, but it is free.
Ok, let’s move on to the formula and dissect that a little bit.
The Formula for Earnings Power Value
As we mentioned above the formula for the earnings power value is simple; it consists of:
EPV = Adjusted Earnings / Cost of Capital (WACC)
Before we dive in and learn about this formula, if you are not familiar with the cost of capital or WACC, please follow this link to learn more about those items before moving on:
Before we start to pick the formula apart and define the different segments of the formula, we need to consider three items:
- The value of any assets competitors must have to compete with the company in the market.
- The earnings power value that we arrive at we base on the current financial conditions of the company and ignore any business cycles to arrive at the intrinsic value.
- We will ignore the growth in this equation, whether growth is a factor or not for the company.
There are multiple steps that need to be followed to arrive at the earnings power value; once we arrive, we can then calculate the intrinsic value from the equity value.
Let’s move on and discover how to calculate earnings power value.
How to Calculate Earnings Power Value
As mentioned, there are six steps we need to follow to calculate the earnings power value.
For our walkthrough of the steps, I would like to value Intel (INTC), the semiconductor company. The company currently has a market cap of $257 billion, and a current market price of $60.97
The six steps we need to work through:
- Step One: Estimate the Adjusted EBIT Margin
- Step Two: Estimate a Normalized EBIT Margin
- Step Three: Estimate a Normalized Tax Rate
- Step Four: Estimate Maintenance CapEx
- Step Five: Calculate Adjusted Earnings
- Step Six: Calculate Intrinsic Value
Ok, I will walk you through all six steps for Intel with explanations and pictures for you to follow along. The steps may look a little daunting, but once you peel away the layers, you will find it is not so bad.
In essence, the first four steps are the process of adjusting and normalizing the earnings for the denominator of the formula.
Step One: Estimate the Adjusted EBIT Margin
Adjusted earnings are the bread and butter of this formula, so that we will be working with this for most of the walkthrough.
The formula for adjusted earnings:
Adjusted Earnings = Normaled EBIT – Tax Expense – Maintenance CapEx + Depreciation & Amortization (95% of CapEx)
Where EBIT equals Earnings Before Interest and Taxes.
Before we begin a note about normalizing earnings or any other numbers, for our purposes today, we will take five years of numbers and then use either the average of those years or the median.
By utilizing normalization, it helps smooth out the numbers and give you a less volatile calculation.
For the first step, we will need revenues, operating income, and depreciation, which we will gather from both the income statement and the cash flow statement.
Below is the breakdown to find the adjusted EBIT.
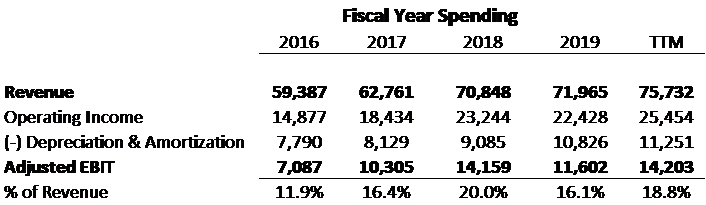
After we subtract the depreciation and amortization from the operating income, we arrive at the adjusted EBIT, which we then divide by the revenue to get our percentage of adjusted earnings to revenue.
Next, we will find the low, median, and highest values from those percentages of the adjusted EBIT margin.

Step Two: Estimate a Normalized EBIT Margin
AS we mentioned above, the earnings power value contains no traces of growth. Therefore we need to remove items of growth from the EBIT. Those items are research & development, marketing, and SG&A (sales, general, and administration).
Again, we will find all these items listed on the income statements from the annual reports or 10-k.
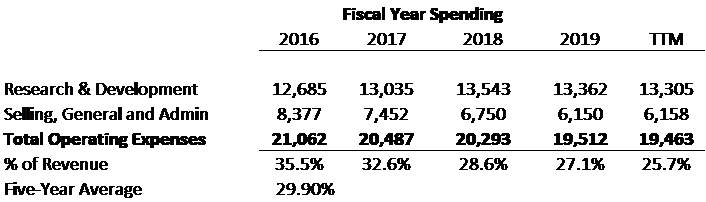
Once we have both of those figures easily add them up and then divide them by the revenue from above, once we have that percentage of revenue, we can find the average of those numbers.
Once we have both of those line items added up, we are going to add them back to the EBIT because the EBIT contains all expenses removed; we need to add them back.
Once we the operating expenses margin, we are going to find the low, medium, and high values of those percentages.
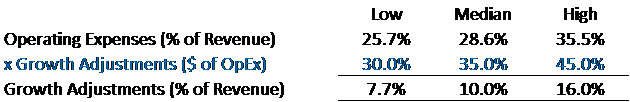
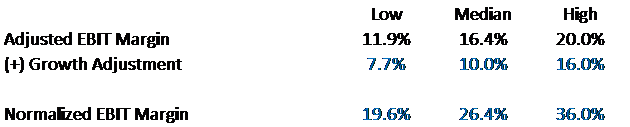
And then, we will estimate growth adjustments that we will apply to the operating expenses percentage which will give us a boost to the EBIT.
The model we are using gives a boost to the adjusted EBIT margin we calculated a moment ago, to calculate the normalized EBIT margin. Remember this EBIT margin assumption as we will use it to calculate normalized EBIT in step five.
Step Three: Estimate a Normalized Tax Rate
Next up is taxes, yuch, who likes taxes? No one! But they are a necessary evil, and we need to account for them in our normalized earnings.
The next step is to normalize the tax rate by dividing the income tax expense by the income before taxes. Again we will find all of this information on the income statement.

Once we have our effective tax rates for the five years, we take an average of those years and arrive at the rate of 21.70%.
Not bad, but a little low for me, and with the upcoming election and the likelihood of a Democratic lead government, tax rates are going to climb. To hedge that bet I am going to estimate a going tax rate for Intel of 25%, you can easily increase that if you feel it is justified.

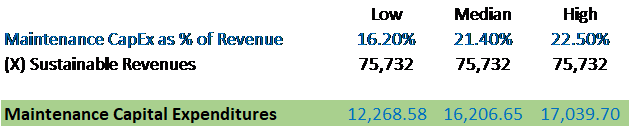
Step Four: Estimating Maintenance CapEx
As company ages, its equipment such as computers, office space, and other properties start to wear down, and they need to be replaced. Accouting for this normal wear and tear, we must estimate how much we think the company will spend on capex (capital expenditures) to continue with its current level of earnings.
We can find these numbers from both the income statement and the cash flow statement.

Once we have our numbers, we can then compare the capex to the revenue for our percentage of revenue.
Next, we will find the low, medium, and high values of the percentages and then multiply those values by the sustainable revenues.
The sustainable revenue is the last year/quarter’s revenue, as we assume in this formula that those revenues will continue going forward.
In the case of Intel, I am using the TTM, but you can use the last annual report just as easily. All of which will give us our maintenance capex numbers.
Step Five: Calculate Adjusted Earnings
Next to the last step, it is time to calculate our adjusted earnings for Intel. As mentioned above, we will use the TTM as the sustainable revenues for the formula.
All the numbers will pull from the steps we followed above, for reference.
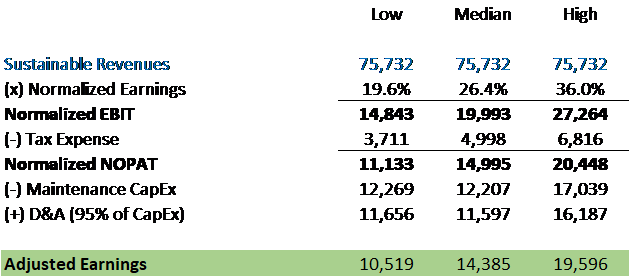
A few notes, once we input the sustainable revenues and multiply that by the normalized earnings percentage, we will arrive at our normalized EBIT. To find the tax expense for our formula, we need to multiple the normalized EBIT by 25%, which was the tax rate I decided to use.
Once we expense the taxes we arrive at our normalized NOPAT (Net Operating Profit After Tax), which we then subtract the maintenance capex and add back in the Depreciation & Amortization percentage, which we find by multiplying 95 percent by the maintenance capex.
After all that gobbly goop is done, we arrive at our adjusted earnings for Intel.
Have we got that? If you are confused, just follow the chart down and it should make much more sense.
Step Six: Calculate Intrinsic Value
Now that we have arrived at our adjusted earnings, we can calculate the intrinsic value based on our range of earnings.
The next value we need is the WACC to find our intrinsic value, for the formula I am going to use a range of numbers for the low, medium and high values to find a range of intrinsic values.
To do this, we divide the adjusted earnings by the cost of capital or WACC; once that is done, it gives us the enterprise value of the company. Remember that enterprise value contains items such as debt and cash, which we need to account for in the calculations.
To do that, we add the cash and equivalents to the enterprise value, and then subtract the debt from the enterprise value to arrive at our equity value. The numbers we use for the cash and debt I am using from the TTM, but you can use the last year’s numbers from the 10-k. As with the sustainable revenues, use last year’s numbers, not an average or median.
After all that is calculated, we have our equity value for Intel; we can then divide that equity by the shares outstanding from the TTM or last annual report to arrive at our intrinsic value.
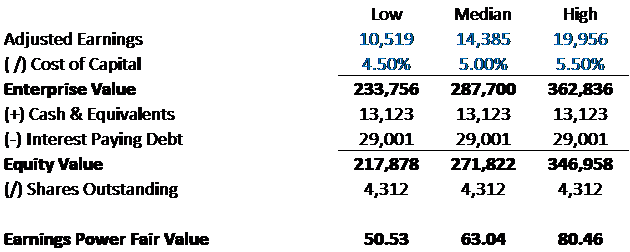
As mentioned above, the current market price for Intel is $60.97, which indicates that for both the median and high values, Intel is undervalued, based on the earnings power of the company.
As a comparison to the current price of Nvidia, who is one of the tech world competitors of Intel.

With Nvidia having a current market price of $413.14, it appears that Nvidia is overvalued based on our calculations.
The cost of capital is an important figure in the formula, and for the above calculations, I did put a pretty conservative number; I have seen some calculations using a higher cost of capital, which drives down the value. I like to use the more conservative numbers because it is closer to the lower beta, lower risk-free rates that are prevalent in the markets today.
For those of you familiar with owner earnings, the structure is similar, and in fact, you can easily substitute that for the adjusted earnings, if that is more your cup of tea.
What Does The Earnings Power Value Tell Us?
The earnings power value formula is another way to determine the intrinsic value of a company. The main difference from a discounted cash flow is the elimination of estimating growth rates, cost of capital, growth margins, and required investments.
The EPV does contain the cost of capital, but it eschews the growth portion of a DCF, which is one of the main challenges of using a DCF.
Use of this formula with a DCF and any other intrinsic valuation method you choose is another tool to use to help you find a margin of safety in every investment you make.
Limitations of the Model
Like any formula or model we use to find the intrinsic value of any company, the EPV has limitations.
Greenwald based the formula on the idea that the conditions surrounding any company will remain constant and in the perfect state.
There are no accommodations for any issues, either within the company or from externally, such as from the market. Any issue with operations that affects the company is not accounted for in this model.
Any of the risks associated with the business, such as macro factors, supply chain issues, personnel problems, or regulatory regulations that might affect operations of the company, are not accounted for in this model.
Accounting for those risks is part of the valuation process, and if you are using this formula, you will need to account for those ideas or items separately.
Final Thoughts
The earnings power value formula is a straightforward way to find the intrinsic value of a company. The formula doesn’t account for growth, which is a huge component of many companies, which means you will find some of the bigger growth companies such as Amazon, Facebook, Netflix, and Google as overvalued.
The argument is the market prices in those growth assumptions, but when you address the fundamentals of any company, you take it at face value and try to assess what you think someone will pay for those assets.
In essence, any intrinsic value calculation is trying to estimate what those assets are worth and how much someone will be willing to pay for those assets.
That is going to wrap up our discussion on the earnings power value formula.
As always, thank you for taking the time to read this post, and I hope you find something of value for your investing journey.
If I can be of any further assistance, please don’t hesitate to reach out.
Until next time, take care and be safe out there,
Dave

Dave Ahern
Dave, a self-taught investor, empowers investors to start investing by demystifying the stock market.
