“Intrinsic value is an all-important concept that offers the only logical approach to evaluating the relative attractiveness of investments and businesses. Intrinsic value can be defined simply: It is the discounted value of the cash that can be taken out of a business during its remaining life.”
These thoughts come directly from page 4 of Warren Buffett’s owners manual.
Buffett has commented on intrinsic value multiple times throughout his annual letters to shareholders, as well as his speeches, interviews, etc.
However, he has never exactly outlined the exact formula that he uses, if he even uses one.
According to Charlie Munger:
“Warren often talks about these discounted cash flows, but I’ve never seen him do one. If it isn’t perfectly obvious that it’s going to work out well if you do the calculation, then he tends to go on to the next idea.”
My idea with this post is to explore some of his ideas and see if we can put together a formula based on these ideas that we can use.
And then put the formula to the test to see if it could work for us.
Remember, with any formula we are looking for approximate value, not an exact number.
As Warren likes to say “it is better to be approximately correct than precisely wrong.”
Warren Buffett thoughts on Intrinsic Value
“Intrinsic value is an all-important concept that offers the only logical approach to evaluating the relative attractiveness of investments and businesses. Intrinsic value can be defined simply: It is the discounted value of the cash that can be taken out of a business during its remaining life.
The calculation of intrinsic value, though, is not so simple. As our definition suggests, intrinsic value is an estimate rather than a precise figure, and it is additionally an estimate that must be changed if interest rates move or forecasts of future cash flows are revised. Two people looking at the same set of facts, moreover – and this would apply even to Charlie and me – will almost inevitably come up with at least slightly different intrinsic value figures. That is one reason we never give you our estimates of intrinsic value. What our annual reports do supply, though, are the facts that we ourselves use to calculate this value.”
Why is he so vague on the exact formula he might use? Especially considering he is so upfront about everything else in his investing philosophy.
My thought is this. Warren wants us to do it for ourselves because it is an estimate only and not a precise number.
Warren believes, and I agree that intrinsic value calculations are an art form, not some exact model that you plug numbers into and out spits a number you can use to buy stocks.
He gives us all the information we need if we put together the clues from his annual letters to shareholders. As he says, it is all right there for us to use.
It is just a matter of us picking up the pieces and trying to put the puzzle together.
Owner Earnings
The first things we need to calculate is the owner earnings for our company. As I have explained in a few articles previous, this is how Buffett looks at free cash flow.
He looks at how to calculate free cash flow, and he eschews that.
Without going into the weeds on this subject, let’s say he doesn’t agree with how they are calculated and has created his formula.
This formula adds things back in such as depreciation, changes in working capital and such. Buffett feels that this more accurately reflects the actual cash flow that an owner receives.
For a refresher on the formula, here we go.
In the 1986 Annual Letter to Shareholders, Buffett said this:
“These represent (a) reported earnings plus (b) depreciation, depletion, amortization, and certain other non-cash charges…less (c) the average annual amount of capitalized expenditures for plant and equipment, etc. that the business requires to fully maintain its long-term competitive position and its unit volume. (If the business requires additional working capital to maintain its competitive position and unit volume, the increment also should be included in (c))…Our owner-earnings equation does not yield the deceptively precise figures provided by GAAP, since (c) must be a guess – and one sometimes very difficult to make. Despite this problem, we consider the owner earnings figure, not the GAAP figure, to be the relevant item for valuation purposes – both for investors in buying stocks and for managers in buying entire businesses…All of this points up the absurdity of the ‘cash flow’ numbers that are often set forth in Wall Street reports. These numbers routinely include (a) plus (b) – but do not subtract (c).”
To make all that a little simpler.
Owner Earnings = (Net Income + Depreciation, Depletion, and Amortization + Change in Deferred Tax – 5yr Average of Maintenance Capital Expenditure + Change in Working Capital)
You will find all of these items in the cash flow statement of any public company.
Now, I have taken all of this information from the 10-ks to calculate our owner earnings.
What better company to practice on than a dividend aristocrat? For his exercise, I am going to use Hormel. A pretty easy to understand company with a great record of growing their dividends and was fairly resistant to the last financial crisis.

Click to zoomThe table gives us the owner earnings for Hormel for the last ten years. These earnings will be the building blocks of our discounted cash flow that we will calculate.
Buffet’s Thoughts on Discount Rates
The next big component of a discounted cash flow is the discount rate.
There are several ways to go with discount rates. You can use the “traditional” method of calculating discount rates using the CAPM models and beta, which is what I first cut my teeth on learning discounted cash flows.
Or you can try the Warren Buffett approach of using discount rates based on a long-term government rate. Let’s see what he has to say about this.
“We think in terms of the long-term government rate.
And there may be times, when in a very — because we don’t think we’re any good at predicting interest rates, but probably in times of very — what would seem like very low rates — we might use a little higher rate.
But we don’t put the risk factor in, per se, because essentially, the purity of the idea is that you’re discounting future cash. And it doesn’t make any difference whether cash comes from a risky business or a safe business — so-called safe business. So, the value of the cash delivered by a water company, which is going to be around for a hundred years, is not different than the value of the cash derived from some high-tech company, if any, that — (laughter) — you might be looking at.
It may be harder for you to make the estimate. And you may, therefore, want a bigger discount when you get all through with the calculation. But up to the point where you decide what you’re willing to pay — you may decide you can’t estimate it at all. I mean, that’s what happens with us with most companies.
But we believe in using a government bond-type interest rate. We believe in trying to stick with businesses where we think we can see the future reasonably well — you never see it perfectly, obviously — but where we think we have a reasonable handle on it.
And we would differentiate to some extent. We don’t want to go below a certain threshold of understanding. So, we want to stick with businesses we think we understand quite well, and not try to have the whole panoply with all different kinds of risk rates, because, frankly, we think that’d just be playing games with numbers.
I mean, we — I don’t think you can stick something — numbers on a highly speculative business, where the whole industry’s going to change in five years, and have it mean anything when you get through.
If you say I’m going to stick an extra 6 percent in on the interest rate to allow for the fact — I tend to think that’s kind of nonsense. I mean, it may look mathematical. But it’s mathematical gibberish in my view.
You better just stick with businesses that you can understand, use the government bond rate. And when you can buy them — something you understand well — at a significant discount, then, you should start getting excited.”
The quote comes for the 1996 Annual Shareholders meeting, morning session. Start at 2:00:20 and end at 2:03:35.
Laying it all out, he and Charlie believe they are better off using the long-term corporate rate for stable, low-growth businesses which are the kind they favor buying.
So, what do we do now? Keep in mind that this was stated during the mid-90s when interest was quite a bit higher than they are today.
To illustrate this look at the monthly breakdown of the 10-year Treasuries rates in 1996.
- Jan 96 5.65%
- Feb 96 5.81%
- Mar 96 6.27%
- Apr 96 6.51%
- May 96 6.74%
- June 96 6.91%
- July 96 6.87%
- Aug 96 6.64%
- Sep 96 6.83%
- Oct 96 6.53%
- Nov 96 6.20%
- Dec 96 6.30%
That works out to an average of 6.44% for the year in 1996. Compare this to 2018
- Jan 18 2.58%
- Feb 18 2.86%
- Mar 18 2.84%
- Apr 18 2.87%
- May 18 2.98%
- June 18 2.91%
- July 18 2.89%
- Aug 18 2.89%
- Sep 18 3.00%
- Oct 18 3.15%
- Nov 18 3.12%
- Dec 18 2.85%
The chart yields an average of 2.70%, which is quite a change from our rate from 1996. The differences certainly illustrate the difference in the rate environments of the different eras.
The current 30-year treasury bill rate is 3.02%, as of March 13, 2019.
So which way do we go? For this exercise, we are going to use the average from 1996 as our starting point of 6.44%.
By doing it this way as opposed to the “traditional” way, it helps to eliminate all the calculations for beta and CAPM, which can be quite laborious and confusing to new investors just starting.
Buffett being Buffett, he always tries to go for simple as opposed to complicated. That is part of his particular brilliance and what one of the traits that make Buffett the finest investor of our generation.
Which one do we use then?
The discount rate from 1996 or today? I am going to use the rate that he would have used during 1996 to get an idea of whether those rates would work.
I think they will.
We have two other rates to discuss, the first being our growth rate that we believe the company will continue to grow over our ten-year period.
Based on our previous discussion about growth and free-cash-flow, we can look at the growth of our owner earnings over the last ten years and extrapolate a growth rate over that time.
Buffett has said numerous times that he believes owner earnings are a better representation of the “free cash flow” of a company than the traditional means of calculating.
So if we look back at our charts and do some quick math, we can see that the earnings grew at an average of 10.88% over the ten years.
One of the tricks when working with earnings and averages is that they are not always accurate. We will have to use estimates from time to time.
The trick is not to go crazy and overestimate. In our case when we figure out what the terminal rate is going to be. We need our growth rate to be higher than the terminal rate or the formula will not work.
So in Hormel’s case, with a 10.88% growth rate over the 10 year period is pretty good by any stretch, but given it is a company with a huge market cap. Given that Hormel has grown at that rate, I am going to use 5% in the interest of being as conservative as possible.
The growth rate of company this size could be lower and that would not be out of the question. But Hormel has proven over the years that it is able to continue to grow at a good rate.
If the economy starts to heat up then we will have to adjust our estimates.
There are several ways to go with this portion of the calculations; you can either pick a number based on numbers that you pull from the annual reports.
Or you can use analysts predictions as well. I prefer to use numbers as I feel they have some sort of basis in reality and aren’t skewed by my prejudices towards the company, good or bad.
FYI the analysts predict a 10.6% growth rate over the next 10 years based on the median of the growth rate of the last ten years.
Next up is the terminal value.
The terminal value is the rate by which we think the company will be growing at the end of our ten years.
One thing to keep in mind is that this rate can not continue growing to infinity, as nice as that would be. A safe rate to use for our growth at the end of the ten-years would be the growth of our economy, the GDP.
According to tradingeconomics.com, the current GDP growth rate for the US as of March 2019 is 2.2%
So that is the number we will use to calculate our terminal value at the end of the DCF.
Putting it all together, examples
Now that we have gathered all the pieces we need and discussed the theories behind the pieces, let’s start to put this all together, shall we?
Let’s start with our discount rate and calculating that so we can discount our owner earnings.
The formula to calculate our growth of owner earnings per year for the ten years is:
Current owner earnings year one X ( 1 + estimated growth rate )
Year 2: Estimated owner earnings X ( 1 + estimated growth rate )
And so on through until we reach the 10th year.
Let’s put this into play by showing the math for the first two years and then I will lay the rest out in a chart for ease of our users.
A note that all numbers will be listed as in the millions unless otherwise stated.
- Current owner earnings year one = $1034
- Estimated starting growth rate = 5%
Plugging in the info we get:
Year 1 = 1034 x ( 1 + .05 )
Year 1 = 1085.7
Year 2 = 1085.7 x ( 1.05 )
Year 2 = 1139.9
And so on. The chart will start to bend the growth rate towards the 2.2% of the economy at the end of ten years.

Next up is calculating the discount rate for our formula based on the average 30-year rate from 1996.
The formula for calculating the discount rate is:
1 / ( 1 + discount rate )
Or in this case 1 / ( 1 + .644 )
To calculate then we get a rate of 0.9395
So the next step would be 0.9395 / 1.644
Which would equal = 0.8827 and so on..
Now that we have calculated our owner earnings and our discount rate we can figure out what our discounted cash flows would be for the next ten years.
To do this we simply multiply the owner earnings by the discount rate to discover our discounted cash flows.
So in the first year, we are going to multiply 1085.7 x 0.9395, which will equal 1021.01 and so on up the line.
See chart below for the data for the 10 years.

Now that we have calculated our discounted cash flows it is time to find our terminal value of these cash flows. The first step will be to add up the totals of all ten years of discounted cash flows.
This would equal $9,400.25.
Once we have added the discounted cash flows, these are called the net present value by the way.
We will now calculate our terminal value of these cash flows. The formula for this is:
Year 10 Discounted Cash Flow x ( 1 + Terminal growth rate ) / Discount rate – Terminal growth rate )
So plugging in the numbers that we have calculated so far:
TV = ( 1533.02 x 1.022 ) / ( 6.44% – 2.20% )
TV = $36,951.47
Next we are going to discount our terminal value by multiplying it by the discount rate that we have been using.
Discounted Terminal Value = $36,951.47 x (6.44%)^10 or $36,951.47 x 0.5357 = $19,796.26
Now that we have our net present value for the ten years and our discounted terminal value for the 10th year we can calculate the intrinsic value for Hormel after ten years.
We do this by simply added the two numbers together.
Intrinsic value = Net present value + Discounted Terminal Value
Intrinsic value = $9,400.25 + $19,796.26
Intrinsic value = $29,196.51
Finally, we can put all this together to arrive at a per-share price based on our calculations.
To do this we take the intrinsic value and add cash on hand and then subtract any long-term debt and then we divide all that by the shares outstanding.
We can find the cash and cash equivalents as well as the long-term debt in the balance sheet
Intrinsic value per share = ( Intrinsic value + (cash – debt) / shares outstanding )
Plugging in the numbers:
Intrinsic value per share = ( 29,196.51 + ( 459 – 625 )) / 543.9 )
Intrinsic value per share = $53.99
Compare this to the current price of Hormel as of year end 2019, which is $43.64. When we compare our intrinsic value to the current price, it appears that Hormel is undervalued?
The question to ask is this correct?
The answer is much harder to come by. The answer is where the art of value investing comes in to play.
Next, I would take a quick peek at some ratios like the P/E. Hormels current P/E is 23.71 which is a relatively decent number, not high but maybe a little pricy. If we flip the P/E ratio we find the earnings yield of 4%, which is far below the 6.44% we used for the discount rate or required return.
A couple of other ratios would be the price to sales and price to book. These are 2.22 and 3.66, which are a little on the high side for my liking. Additionally, these numbers are on the higher side for their historical ten-year results.
One idea to keep in mind when exploring this idea, the closer the discount rate comes to the terminal rate, the higher the valuation is going to climb. Finally looking at the ten-year history of Hormel, it is unquestionable that the company is growing its owner earnings over the last ten years. It has also weathered the last Great Recession quite well.
But I feel like based on the calculations that we just did the company is a little pricy for the growth it has seen. The rising prices could be a result of the rising tide of the market.
Additionally, because Hormel is a Dividend Aristocrat and has done a fantastic job raising their dividend over the years, everyone wants to own the company, which drives the prices up over time.
Remember when we do these calculations, they are just estimates, we will never come up with a finite number that will tell you must buy or sell this company right now.
As Buffett likes to say “it is better to be approximately right than precisely wrong.”
Let’s take a look at one more company for giggles to see how this will work for us.
This time I am going to do the calculations for you and lay out the charts to see what I am doing.
Discounted Cash Flow for Oshkosh Corp (examples)
Let’s take a look at the owner earnings for the last ten years for Oshkosh Corp (OSK).
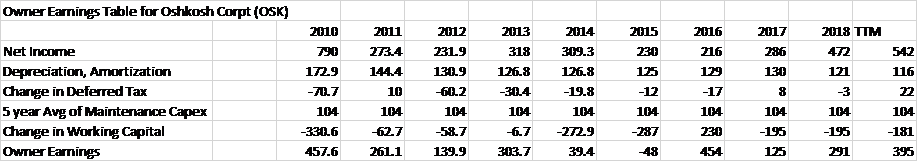
Next up we will calculate the discounted cash of the owner earnings. For our exercise we are going to assume a 3% growth rate as well as a 6.44% discount rate per our last example.

Now that we have calculated our discounted cash flows we can look at finding the intrinsic value of Oshkosh Corp.
Terminal Value will include the Year 10 discounted owner earnings of $394.23 and the discount rate of 6.44% and the terminal discount rate of 2.2% of the GDP of the economy.
Therefore the Terminal value will equal $12,452.18
Next, we will discount this Terminal Value by 6.44% to get:
Discounted Terminal Value = $6,671.09
Lastly, we will put together the intrinsic value by adding the total of our discounted owner earnings and our discounted terminal value.
Intrinsic value = $3,292.62 + $6,671.09
Intrinsic value = $9,963.71
The final step is to calculate our per share data to determine whether the stock is “cheap” or not.
To do this, we will take our total intrinsic value and cash or cash equivalents and subtract long-term debt and then divide all that by the shares outstanding.
Pulling the numbers from the balance sheet of Oshkosh Corp we get:
Cash = $455
Debt = $818
Shares Outstanding = 73.1
Plugging the numbers into the equation.
Intrinsic value per share = (9,963.71 + (455 – 818)) / 73.1
Once calculating we get a per-share price of $131.34, as compared to the current price of $71.24
If our calculations are correct, this will give us a margin of safety close to 100%. Again this illustrates that the closer the discount rate gets to the terminal rate, the higher the valuation.
To me, this highlights the idea that using the long-term growth rates will work, until the rates drop as they have recently. As interest rates fall, valuations will rise.
For example, if we change the discount rate to the current long-term rate of 3.02% and keep all other numbers the same we get a value of $702.79. So, the closer the discount rate to the terminal rate the higher the valuations. That is why it is harder to find good values when interest rates fall, because the valuations rise.
If we use the cost of equity or WACC of 13.60% as our discount rate for Oshkosh Corp the value of the company would be $45.38. As you can see from the three discount rates, they matter greatly, and require a lot of consideration and thought.
Final Thoughts On Discounted Owner Earnings
One of the fun parts of doing these exercises is determining what to assume in regards to rates to us. None of know the future, so our best bet is to try to be conservative.
As witnessed by doing this exercise for Oshkosh Corp, if our growth rate is different, or the discount rates are different, then our number can change completely.
The above examples show the power of making estimates and basing our investment decisions on these estimates.
As a value investor, I prefer to go lower and try to be more conservative.
I think this post illustrates that the ideas that Buffett and Munger have both espoused have some merit and can bear some fruit.
Using discounted cash flows to help determine future intrinsic value is a great exercise to project into the future. But remember these are only projections and ONLY as good as the numbers we plug in.
Based on using the suggestions from Buffett and Munger it also helps us avoid using beta and the Cape ratio which can be more difficult to calculate and lead to longer calculations. We can see that using rates closer to the long-term returns you expect to lead to more reasonable valuations.
Remember that Buffett’s mind is like a computer and he can spit these calculations out in his head, unlike us mere mortals that need to rely on spreadsheets.
I agree with Buffett in that trying to keep things simple can help avoid mistakes of calculations as well as errors in judgment.
After all one of his favorite sayings is “that it is better to be approximately correct as opposed to precisely wrong.”
You are never going to get an exact number doing any of these models. The trick is to find a range of possibilities and determining whether those possibilities are correct.
I hope you enjoyed this dive into the minds of Warren Buffet and Charlie Munger; I know I sure have.
Please let me know your thoughts or if you have any questions.
As always, thanks for taking the time to read this and invest with a margin of safety, emphasis on the safety.
Take care,
Dave

Dave Ahern
Dave, a self-taught investor, empowers investors to start investing by demystifying the stock market.
