The FAANG companies—aka Facebook, Apple, Amazon, Netflix, Google—are technology leaders of the stock market known for their high rates of growth. They are sometimes referred to as “Big Tech”.
There is no special qualification to be a FAANG stock; it’s simply a catchy acronym to represent some companies which have done really, really well in the 2010’s. (CNBC’s Jim Cramer is the one who invented the term).
The FAANG companies are not the only technology leaders of the stock market—Microsoft, NVIDIA, Broadcom, and Cisco are all bigger (in market capitalization) than Netflix for example…
And the list of high growth technology leaders is likely to change over time… as this is the very definition of technology (it tends to be innovative and disruptive).
That all said, let’s look at what makes the FAANG companies special: their growth.
Can the FAANGs continue their insane levels of growth?
FAANG Companies List (Growth Rates)
As I write this, based on each company’s latest annual report, the latest 3-year revenue growth for each of the FAANGs looks like this:
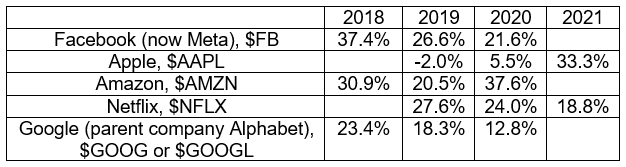
What’s equally incredible about these companies is how they’ve achieved this ultra high growth in spite of their massive size.
Companies’ growth rates tend to slow down as they get bigger; the FAANG companies seem to defy gravity in their abilities to continue to grow.
Going back to our list, here’s the latest annual revenue number for each company:
- FB: $86 billion
- AAPL: $365 billion
- AMZN: $386 billion
- NFLX: $29.7 billion
- GOOG: $182 billion
And finally, the stocks for each of these companies have predictably done extremely well as these high growth rates have been maintained.
For example, here’s the 5Y stock price growth for each:
- FB: +139.44%
- AAPL: +442.48%
- AMZN: +263.29%
- NFLX: +224.71%
- GOOG: +246.56%
For reference, the S&P 500 has returned +99.45% over the last 5 years, showing that investing in these FAANG stocks would’ve been a killer move assuming you bought 5 years ago and sold today.
But…
Past performance is not a guarantee for future success.
Regardless of what anyone tells you, the truth of the matter is that high growth in the stock market is not a new concept.
Just as every tree does not grow to the moon, a company cannot grow above the limits of the economy. Some factors which tend to erode at companies’ success include:
- Resting on their laurels
- Government intervention
- Falling behind on innovative technology
- The law of percentages and big numbers
- Competitive moats deteriorating
It’s easy for a company to lose focus on their core customers as they chase ever high levels of growth in new fields.
It’s easy for a company to waste investment dollars chasing new projects which may never materialize into future growth.
It’s easy for a big company to become bureaucratic, and for their massive size to become a liability instead of an asset (read The Innovator’s Dilemma for an explanation why).
- Is that true for the FAANG stocks?
- Are the best days for the FAANGs behind them?
- Which FAANG stock is the best?
Before we answer that all, let’s look back in history to one of the best high growth stories of all-time. There are some stark parallels to today.
IBM vs FAANGs: The Ultimate High Growth, “Big Tech” Stock of the 1960’s
Most investors today are not old enough to remember the dominance of IBM in the 1950’s and 1960’s. That’s okay, I’m not old enough either.
But we have to respect the limitations of capitalism and the unavoidable ebbs and flows that come with it.
I’m not a historian, so we’ll rely on a few online sources to get a sense of IBM’s dominance.
Grabbing a few key highlights from good ol’ Wikipedia, we can see the cultural significance of “Big Blue” in its punch cards being used for the 1890 census, its first California research lab (in the area later called Silicon Valley) inventing the hard disk drive, its introduction of FORTRAN (most widely used language in programming), its magnetic stripe becoming the world standard for the credit card industry, its introduction of the floppy disk, its innovation which leads to LASIK surgery, and its Deep Blue supercomputer which defeats a World Chess Champ.
Oh and that’s not to mention its computers helping the first men land on the Moon (1969), its DRAM and IBM 5100 helping launch the Personal Computer revolution among its other PC-related innovations, and of course its mainframes which dominated the business services industry (70% market share).
From IBM’s website, here’s some revenue growth rates from IBM in its prime, with revenue starting at $116 million in 1946 ($1.6 billion in today’s inflation-adjusted dollars):
- 1946: +16%
- 1947: +20%
- 1948: +13%
- 1949: +17%
- 1950: +45%
- 1951: +26%
- 1952: +23%
- 1953: +21%
- 1954: +15%
- 1955: +22%
- 1956: +28%
- 1957: +35%
- 1958: +18%
- 1959: +14%
- 1960: +12%
- 1961: +22%
- 1962: +18%
- 1963: +10%
- 1964: +13%
- 1965: +11%
- 1966: +19%
- 1967: +26%
- 1968: +29%
- 1969: +5%
This excellent article, from an IBM-lifer who covered IBM’s historical revenue growth since 1915, details that the 1970’s brought revenue growth rates which fell back down to earth (~10% per year), with each successive decade getting progressively worse and worse (until the 2010’s, where growth was mostly negative).
I think from cherry picking some of the dates above, we could arguably look at IBM in 1968 and use that as a corollary to most of the FAANGs today.
Huge size, huge growth.
IBM’s revenue in 1968 was $6.88 billion. In inflation-adjusted dollars today, that would be $55 billion, meaning most of today’s FAANGs actually have IBM beat in this regard (higher growth at a higher size).
What about IBM’s stock valuation?
IBM had a P/E ratio of around 35 in 1972, which would translate to an extremely high P/E today when adjusting for interest rates. In 1972, the 10-year treasury interest rate (which tends to set the market’s P/E) was around 6%. I estimate a P/E of 35 with 6% interest rates to be equivalent to at least a 57 P/E ratio today.
So, the FAANGs today are arguably just as high growing, bigger, and potentially cheaper (as a stock) than the Big Tech Monster of the 1960’s, IBM.
What’s the Best FAANG Stock Today?
This would be a super tough question to answer, because (A) I don’t have a crystal ball, and (B) each of these FAANG companies are similar yet in mostly different industries.
Let’s look at some of the end markets of these FAANGs, and see if we can estimate a maturation point for each based on the fact that you can’t grow higher than 100% market share (and so growth must slow eventually).
I think Facebook and Google make a good place to start since they share the broad marketing/ advertising industry.
From Facebook’s latest annual report (on Bamsec.com), this is how the company makes its money:
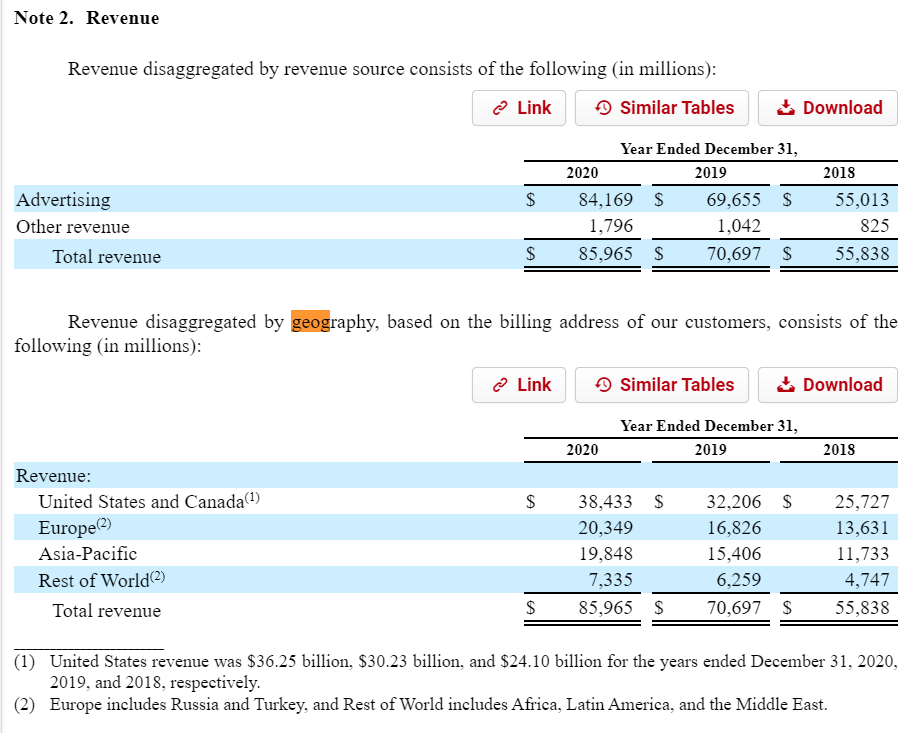
Sorry to U.S. investors (myself included), it’s not all about you and what you’re seeing in your country for a multinational company like Facebook.
From Google’s annual report:
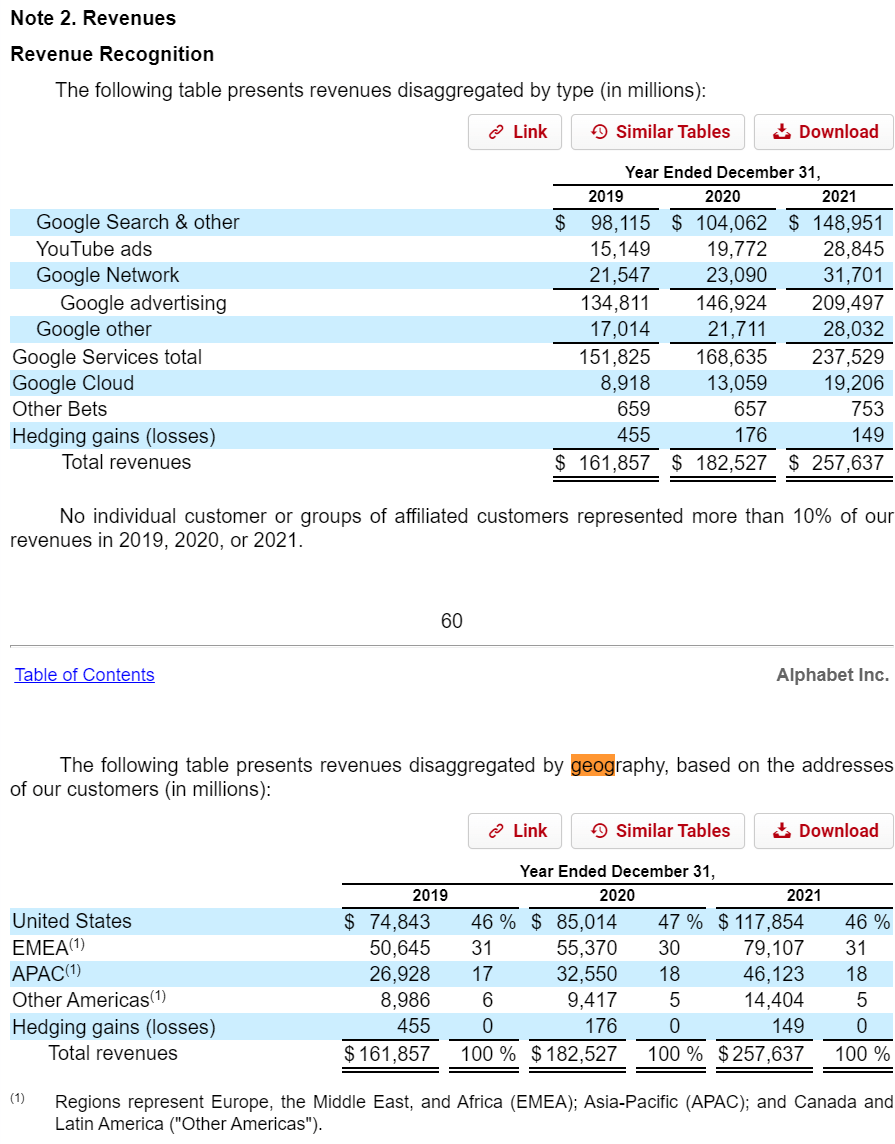
Again, more than half of the company’s revenues come internationally, and a vast majority of all revenues are from advertising (Google Search, Network, and YouTube ads).
[Example] The Marketing Industry: Facebook and Google
I will warn you that simply Googling (wow that’s “meta”) industry sizes can lead you down a path of wildly inaccurate estimates, especially today.
There are market research firms with little credibility which will post numbers which sound good, and media outlets and analysts will just blindly copy those (read my article about stock market tops for a very real example of that).
Every market research firm has their own agenda, and survey data can only go so far.
The truth is for many industries, the actual TAM (Total Addressable Market) is impossible to accurately estimate, since privately held companies are not required to publicly disclose their financial data like publicly traded companies are.
So like Warren Buffett says, let’s be approximately right instead of precisely wrong.
First, let’s start at the top, with basic macroeconomic data.
The World Bank posted GDP numbers for 2020 on their website:
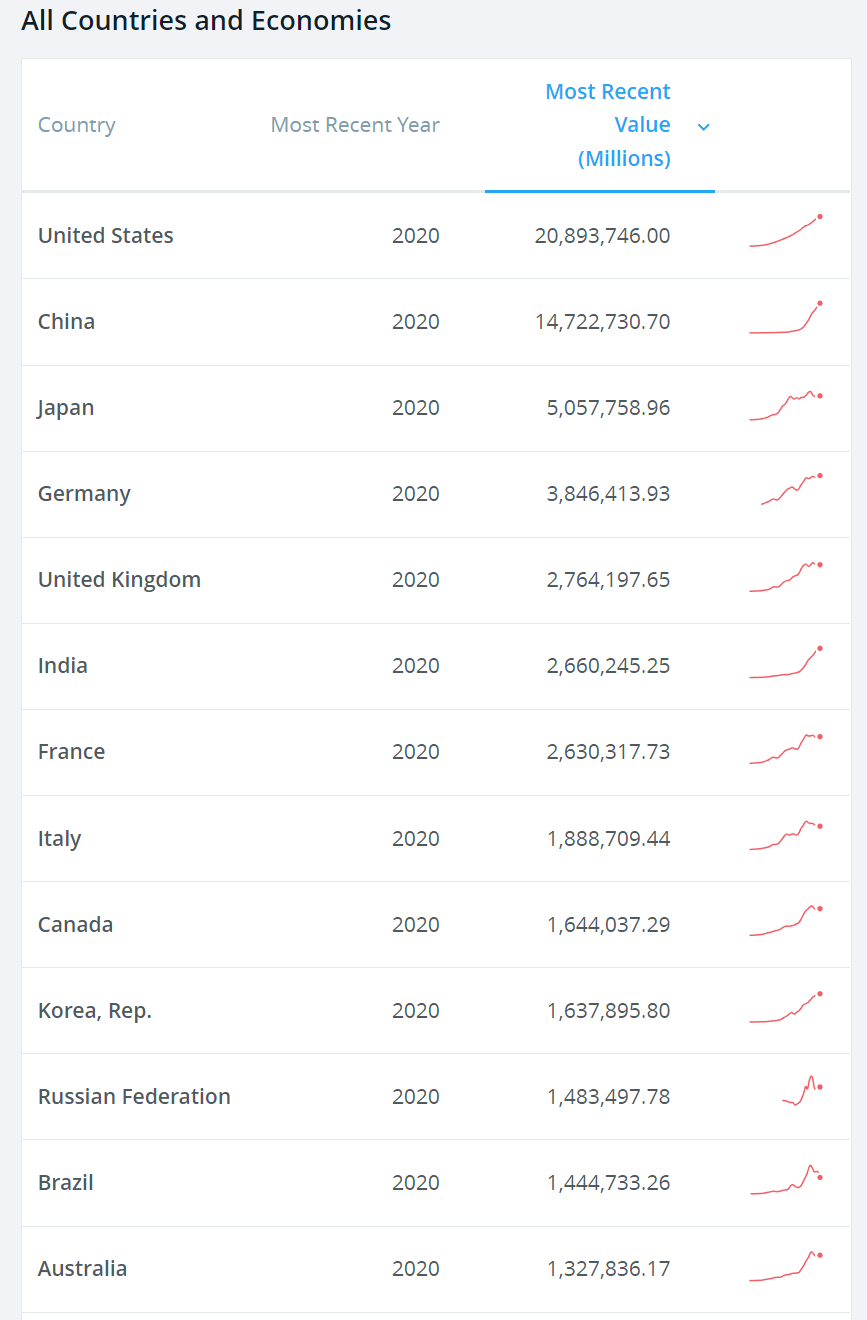
Going back to Google and Facebook, we have to understand that China as a TAM is unreasonable to expect, since they have their own “Big Tech”, and Google and Facebook are locked out of that country.
Excluding China from the list above, we could start with a basic GDP TAM of, let’s say, $45 trillion.
Like I said, we have to be weary about most “market research”, but I like a quote in the Wall Street Journal from (reputable) Deloitte about marketing budgets, and companies on average spending about 7.5% of total revenue on marketing.
Taking 7.5% of $45T, we get about a $3.375T market.
In the past, a significant component of advertising spend went to Television, Radio, and newspapers.
Some of that is bound to continue for all of those platforms, as long as there is some audience there.
It’s also unlikely that either Facebook or Google displace the other, since marketers in the digital space like to use elements of both depending on the business. Maybe, the real TAM for each is closer to $1T instead of $3.375T.
That all said, could Facebook at $86B and Google at $182.5B in revenues have room to grow into a TAM like this, for an attractive return on investment for the stock?
Rather than ask, “which FAANG is the best”, the better question is:
- Is this FAANG stock fairly and reasonably valued today?
FAANG Stocks vs the Economy
You can see that I purposely did not answer which FAANG stock that I believe is best; instead I hope to have spurned additional questions for an investor to ask themselves.
The GDP for the U.S. in 1968 was $942.5 billion, which is $7.5 trillion in today’s U.S. dollars adjusted for inflation. Our economy is actually around $23 trillion today, so it’s greatly outpaced inflation!
Comparing revenues to U.S. GDP, we can see the following relationships:
- IBM (1968) = 0.7% of U.S. GDP
- 10-year EPS growth rate = 21.2%
- FB (2020) = 0.3% of U.S. GDP
- AAPL (2021) = 1.6% of U.S. GDP
- AMZN (2020) = 1.7% of U.S. GDP
- NFLX (2021) = 0.1% of U.S. GDP
- GOOG (2021) = 0.7% of U.S. GDP
We can see from a proportional perspective, some of the FAANGs are very close to IBM-level in 1968.
Looking at this list from CNN Money, we can see the following leaders of that time (and their revenues to U.S. GDP):
- General Motors = 2.1% of U.S. GDP
- 10-year EPS growth rate = 6.6%
- Exxon Mobil = 1.4% of U.S. GDP
- 10-year EPS growth rate = 3.8%
- Ford Motor = 1.1% of U.S. GDP
- 10-year EPS growth rate = -11.5%
- General Electric = 0.8% of U.S. GDP
- 10-year EPS growth rate = 3.4%
- Chrysler = 0.6% of U.S. GDP
- 10-year EPS growth rate = 2.7%
And what I’m sure you’re all wondering, here’s the 10 year CAGR growth rate of EPS for the FAANGs:
- FB: 50.4%
- AAPL: 19%
- AMZN: 32.4%
- NFLX: 34.2%
- GOOG: 16.1%
Remember that over this most recent 10 year period, we’ve seen the corporate tax rate reduce significantly (which raises EPS), and a huge prioritization of buybacks instead of dividends (which also raises EPS).
Still, it’s fascinating to see how the FAANGs today are somewhat the same, and yet somewhat different, from the business titans of the past.
