Executives of public companies like to paint their businesses in a positive light. When communicating with investors – a process known as investor relations – they will make various adjustments to their financial statements to try and convince Wall Street to buy stakes in their businesses.
The most popular of these is adjusted EBITDA. You’ve likely encountered this funny-sounding term if you’ve read any investor relations presentations. Executives claim that adjusted EBITDA is useful because it shows the underlying earnings power of a company, which may be masked by GAAP profitability metrics such as net income.
However, a lot of investors dislike the use of adjusted EBITDA. The Oracle of Omaha, Warren Buffett, can be counted as one of them. He believes it is disingenuous for companies to exclude things like stock-based compensation, interest payments, and depreciation when calculating profitability as these are true expenses that shareholders such as himself are incurring in one way or another.
Here is a direct quote from Buffett on the topic:
“People want to send me books with EBITDA and I say fine, as long as you pay capex. There are very few businesses that can spend a lot less than depreciation and maintain the health of the business. This is nonsense. It couldn’t be worse. But a whole generation of investors have been taught this. It’s not a non-cash expense — it’s a cash expense but you spend it first. It’s a delayed recording of a cash expense.”
Warren Buffett
Instead of adjusted EBITDA, top investors like Buffett focus on one metric over all else to measure the profitability of a business: free cash flow.
In this post, readers will learn:
- How to Calculate Adjusted EBITDA
- How to Calculate Free Cash Flow
- Free Cash Flow Conversion and What It Can Tell Investors
- Why You Should Typically Use Free Cash Flow Over Adjusted EBITDA
How to Calculate Adjusted EBITDA
To understand adjusted EBITDA, we first need to figure out what EBITDA means. Then, we need to figure out what companies are adjusting from it.
Defining EBITDA is simple. It is an acronym for “Earnings Before Interest, Taxes, Depreciation, and Amortization.” To calculate EBITDA, you take a company’s net income and then add back the net interest, taxes, depreciation, and amortization expenses from its financial statements. These can all be found on every publicly traded stock’s income and cash flow statements.
EBITDA = Net Income + Net Interest + Taxes + Depreciation + Amortization Expenses

The “adjusted” part is more difficult to calculate, as it can vary from company to company. For example, if we look at Airbnb’s definition of adjusted EBITDA, they make four extra adjustments outside of the traditional EBITDA metric:
- Stock-based compensation expenses
- Acquisitions related costs
- Unique lodging taxes for its home rental business
- Restructuring charges
However, the most important item being adjusted – especially in software and technology businesses – is typically stock-based compensation. This non-cash expense is included in virtually every measure of adjusted EBITDA and can sometimes run north of 10% of a company’s revenue.
All these exclusions can mean stark differences between a company’s GAAP operating income margin and the adjusted EBITDA margin presented to investors. Last quarter, Airbnb had an operating margin of 44%. Its adjusted EBITDA was 10 points higher at 54%. That’s a big difference that can greatly change any valuation metrics you may look at as an investor, such as the price-to-earnings ratio.
How to Calculate Free Cash Flow
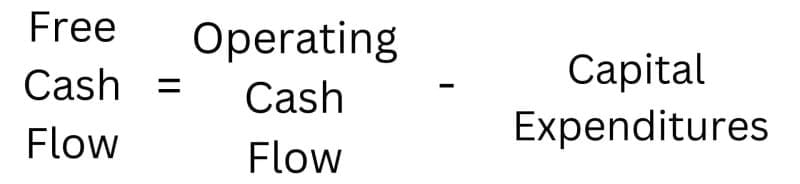
Free cash flow is much easier to calculate than adjusted EBITDA. It also has a broadly accepted formula used worldwide, eliminating confusion for investors. You can think of free cash flow as the cash a company has generated (or lost) before making any principal debt payments and/or returning cash to shareholders through dividends and share repurchases.
To calculate free cash flow, we start with a company’s operating cash flow over a respective period, which can be found in the operating activities line of the cash flow statement. Then, you take that number and subtract a company’s capital expenditures over the same time period, which will typically be called “purchases of property and equipment.” This line item is under the investing activities section of the cash flow statement.
That’s it. This is a simple calculation you can make for any company in less than a minute, telling you how much cash is coming in the door that can be returned to investors and holders of its debt.
The one flaw with the traditional free cash flow measure – which it shares with adjusted EBITDA – is the exclusion of stock-based compensation expense. Since stock-based compensation is technically a non-cash charge, the textbook formula for calculating free cash flow excludes the line item.
To eliminate this flaw, many researchers, such as Michael Mauboussin at Morgan Stanley, think investors should subtract stock-based compensation along with capital expenditures to account for shareholder dilution. While not a cash charge, granting stock to employees is a headwind to creating value for outside shareholders and needs to be accounted for when analyzing the profitability of a company.
Another way to mitigate shareholder dilution risk is by focusing on free cash flow per share instead of just nominal free cash flow generation. Even though you are excluding stock-based compensation from your free cash flow calculation, it will show up at the end of the day in a rising share count if stock units keep getting paid to employees each year.
To calculate free cash flow per share, you take a company’s free cash flow generation over a certain period – typically a year – and divide it by its current number of shares outstanding.
Free cash flow conversion and what it can tell investors
Taking things a step further, it can be helpful for investors to connect these two commonly used metrics together. To do so, we need to calculate free cash flow conversion.
This is another simple formula if you already have free cash flow and adjusted EBITDA metrics for a company. To calculate a company’s free cash flow conversion, you take free cash flow and divide it by adjusted EBITDA. Then, multiply it by 100 to get the measurement in percent terms.
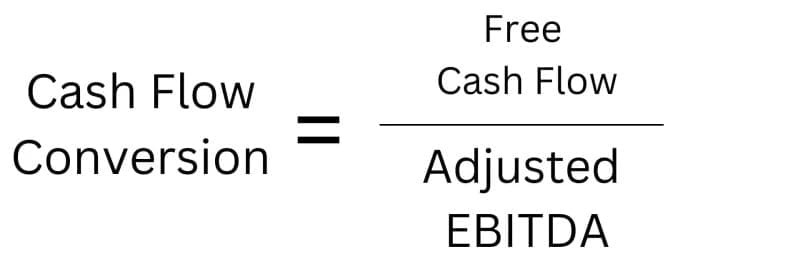
Free cash flow conversion tells investors how much of a company’s adjusted EBITDA is getting turned into cash generated for investors. Closer to 100% is better than 0%, and companies can have greater than 100% free cash flow conversion. Generally, the higher the free cash flow conversion rate, the better. Negative free cash flow conversion means a company claims to generate a profit but is actually burning cash.
Examples
Let’s go through a few examples. One positive, one negative.
First, the good.
Airbnb operates an online marketplace where people can rent out their residences for travelers around the world. As a middleman, it collects money from guests and then pays it to the hosts, taking a cut as its source of revenue.
However, there is always a delay from when travelers give money to Airbnb and when Airbnb pays it to hosts, boosting the cash balance on Airbnb’s balance sheet even though that cash was not technically earned as revenue.
The company can use this cash (up to a point) from guests to finance growth initiatives, earn interest income, and other uses before eventually paying it out to hosts. This is a negative working capital advantage and can be extremely useful for companies in growth mode such as Airbnb. For example, at the end of 2022, Airbnb had close to $5 billion in funds payable to customers as short-term liabilities.
How does this relate to free cash flow conversion? With negative working capital, Airbnb consistently generates higher free cash flow levels than adjusted EBITDA, despite the latter earnings metric excluding numerous expenses and capital expenditures.
In 2022, Airbnb’s free cash flow conversion was 117%. As long as the business model doesn’t change, it should post a free cash flow conversion above 100%, presenting the business with an operational advantage.

Now, for the bad.
On the other end of the free cash flow conversion spectrum, last year was Coupang. The e-commerce leader in South Korea is investing a ton of money into capital expenditures to build out a vertically integrated delivery network, giving it high levels of depreciation and amortization.
In 2022, Coupang generated $381 million in adjusted EBITDA. However, due to its heavy levels of capital expenditures, it had a negative $246 million in free cash flow for a free cash flow conversion of minus 64%. Not great.
Coupang may be correct to invest so aggressively for growth, but it would be disingenuous to say the company generated true profits that can be returned to shareholders in 2022.
These examples show the stark differences in companies’ adjusted EBITDA values. Some, such as Airbnb, may generate as much or more in free cash flow each year than their adjusted EBITDA figures. Others, such as Coupang in 2022, may post hundreds of millions in adjusted EBITDA “profits” while they are actually losing money.
In more general terms, there are two situations where adjusting EBITDA can greatly overstate free cash flow and lead to low free cash flow conversion.
First is a company with heavy net debt that must make sizable interest payments every year.
Second, is a company such as Coupang with a lot of capital expenditures showing up on the income statement as depreciation and amortization.
If a company has large annual expenses that get excluded when calculating EBITDA, then it is unwise to rely on that metric when analyzing the stock.
Why You Should Always Use Free Cash Flow Over Adjusted EBITDA
After reading the above sections, I hope you better understand the differences between free cash flow and adjusted EBITDA. Management teams are constantly talking about adjusted EBITDA, and it can be confusing to understand the term if you haven’t learned about it before.
Investors must hold executives’ feet to the fire when they brag about adjusted EBITDA profitability. Make sure always to calculate free cash flow conversion when looking at a stock that is constantly measuring itself in adjusted EBITDA terms. If a company is hitting a free cash flow conversion rate well below 100% year after year, adjusted EBITDA should not be considered a proxy for its earnings power. Full stop.

Or, you can keep things even simpler and just completely ignore when management teams mention adjusted EBITDA. Cash flow is king and is how a company creates value for shareholders. If you don’t generate free cash flow, you can’t sustainably return capital to shareholders in the form of dividends and share repurchases (and eventually, you’ll run out of money).
While not the only thing that matters for a stock, a company that generates positive free cash flow each year is in a much better spot than one that consistently burns cash. Making adjustments in an investor presentation doesn’t change anything about the situation.
Ultimately, it is much better – and simpler – to ignore adjusted EBITDA and focus on free cash flow when analyzing stocks. It will help you find quality companies for your portfolio while sniffing out poor business models covered up with misleading earnings metrics.

Brett Schafer
Brett Schafer is an investor, host of the Chit Chat Stocks Podcast, and writer at the Motley Fool.
