One of the more popular metrics to take the financial community by storm over the last twenty years is the EBITDA margin, which companies use to determine their operating profitability. The EBITDA margin is a quick, easy way to determine the profitability of any company, but it does come with a little controversy.
If you read through any financial report these days, you will encounter the EBITDA acronym, but what does it actually mean, and how is it used to measure any profitability? EBITDA focuses on the essentials of the business, operating profitability, and cash flow.
Using EBITDA margins also allows you to measure other companies in the same industry, which means you can compare each company’s operating profitability and cash flow.
No analyst would argue that depreciation, amortization, interest, or taxes are unimportant. Still, EBITDA strips all those numbers out and focuses on the company’s cash flow and operating profitability.
In today’s post, we will learn:
- What is the EBITDA margin?
- What Does the EBITDA Margin Tell Us?
- How to Calculate the EBITDA Margin with Real Examples
- Do You Want a High or Low EBITDA Margin?
Ok, let’s dive and learn about the EBITDA margin.
What is EBITDA Margin?
Using the EBITDA margin is a quick way to assess a company’s operating profitability and cash flow. We can calculate EBITDA by dividing the company’s earnings before interest, taxes, depreciation, and amortization by total revenue.
Investors use EBITDA margin to give business owners or investors a better idea of operating profitability and cash flow, representing a percentage of the business’s total revenue.

Unlike other metrics, the EBITDA margin takes a bird’s eye view of the company’s profitability and operations. Still, it avoids getting into the weeds of the individual line items of the income statement.
Earnings represented by the EBITDA margin come from items such as cost of goods sold (COGS) and selling general and administrative (SG&A) but exclude depreciation and amortization.
Depreciation and amortization are the decreases in the value of goods or purchases over time and the spreading out of loans over time. For example, if you buy a computer for your business, you can depreciate that expense over time instead of a one-time charge. So instead of expensing that $1000 at one time, you can charge $100 yearly for ten years until written off. The same idea applies to amortization with a loan; written down over time.
How is the EBITDA margin different from other profit margins such as gross profit, operating profit, or net profit? And why would we use EBITDA margin as opposed to the margins, as mentioned earlier?
Corporate accounting has a standard called generally accepted accounting principles (GAAP). These GAAP standards are requirements for corporate accounting. For example, the EBITDA margin encompasses one of the three principles of GAAP accounting, including gross profit margin, operating profit margin, and net profit margin.
The net profit margin is one of the main ways a company uses GAAP metrics to evaluate whether it can turn a profit based on its revenues or expenses.
GAAP principles standardize the three profit margins, and because of that, they are considered a good indicator of profitability and the financial health of a company.
But, the EBITDA margin operates on a different foundation by using more nuanced metrics to help compare companies to evaluate their health and performance. EBITDA doesn’t adhere to GAAP and is called a non-GAAP measure, and therefore EBITDA differs slightly from other profit margins such as net profit margin.
Also, EBITDA uses moderately different items to measure operational efficiency; as an example, unlike the earlier mentioned GAAP margins, EBITDA uses gross profit, which, for calculating EBITDA, only consists of the total revenue minus costs related to producing the cost of goods for sale. And operating profit includes depreciation and amortization, among other metrics.
Because of this reason, EBITDA is different from the operating margin because, unlike operating margin, EBITDA does include depreciation and amortization.
EBITDA margins are common in mergers and acquisitions of small and large corporations, mostly because it is an easy margin to calculate and compare different industries or sizes of companies.
There are pros and cons to the EBITDA margin; let’s explore them briefly.
Pros
The EBITDA margin measures a company’s cash flows. And for many investors, using EBITDA is a better indicator than other profit margins because it reduces the importance of non-operating or other unique depreciation, amortization, and taxes.
Another pro is the ability to use EBITDA to compare companies across different industries because it compares operating profit to the total revenue as a percentage, which allows for easier comparisons. The margin also allows investors to analyze how well a company uses its operating profits compared to its total revenue.
The EBITDA margin shows an investor or owner how well a company uses its resources and operating cash by showing the correlation between revenue and operating cash flow.
An additional bonus to using the EBITDA margin is the ability to track EBITDA margins over the years to track a company’s progress, as well as compare their efficiency to other companies in their industry.
The main pro is that the EBITDA margin allows owners, investors, or analysts to make more educated decisions about the business based on its operating income efficiency compared to the company’s total revenue.
Cons
Believe it or not, there are some cons to using the EBITDA margin to assess a company.
Some companies can use the EBITDA margin to mislead investors to make the company seem more profitable than it appears because EBITDA excludes any calculations regarding debt. Because of the higher debt levels, those companies will carry much higher interest payments, which erodes profitability.
In addition, companies can appear more profitable with the addition of depreciation and amortization to their profit margin, which skews the numbers higher, which can be misleading to companies with low-profit margins to begin with, which overestimates the profitability of the company.
Another con is the fact EBITDA is a non-GAAP number, which means some unethical companies may use the margin to mislead or misrepresent the true profitability of the company.
Even Forbes has denounced the metric, saying it is misleading by indicating asset-heavy companies are more profitable; it ignores debt, works capital requirements, and lacks GAAP guidelines.
Lastly, Warren Buffett and Charlie Munger denounced the metric, with Charlie referring to them as “b**s**” earnings.
For all of the above reasons, both good and bad, it is best to use EBITDA alongside GAAP metrics to determine a business’s financial health.
What Does the EBITDA Margin Tell Us?
EBITDA helps investors and analysts determine short-term profitability and efficiency. The margin ignores the impacts of non-operating items such as taxes, interest expenses, and intangible assets. These contribute to a metric which accurately assesses the company’s operating profitability, which is why many analysts and investors prefer EBITDA over other profitability metrics.
EBITDA is especially helpful in comparing companies with different debt, tax profiles, and capital investments.
It is also a preferred quarterly earnings release metric and generally is not GAAP audited. For this reason, analysts prefer EBITDA because the metric ignores taxes and interest expenses, allowing analysts to focus on the company’s operational performance.
Depreciation and amortization are non-cash expenses, allowing EBITDA to provide insight into operations that control capital expenditures and cash generation. Profit margins measure income generation compared to a company’s revenue and are used to measure the company’s operational efficiency.
EBITDA is also a useful tool in acquisitions because it focuses on the company’s income and cash creation ability, and EBITDA margins help determine the ability of an acquired company to fit with the new company.
Ok, now that we understand EBITDA and the pros and cons, let’s look at how to calculate this profitability margin.
How to Calculate the EBITDA Margin with Examples
We can calculate the EBITDA margin using numbers pulled directly from any company’s quarterly or annual income statement. I like to use the annual numbers, or the TTM, depending on where we are on the filing schedule.
For our first example, I would like to use Moody’s (MCO), the bond rating agency. The company is one of Warren Buffett’s investments and currently has a market price of $290.38 and a market cap of $53.35B.
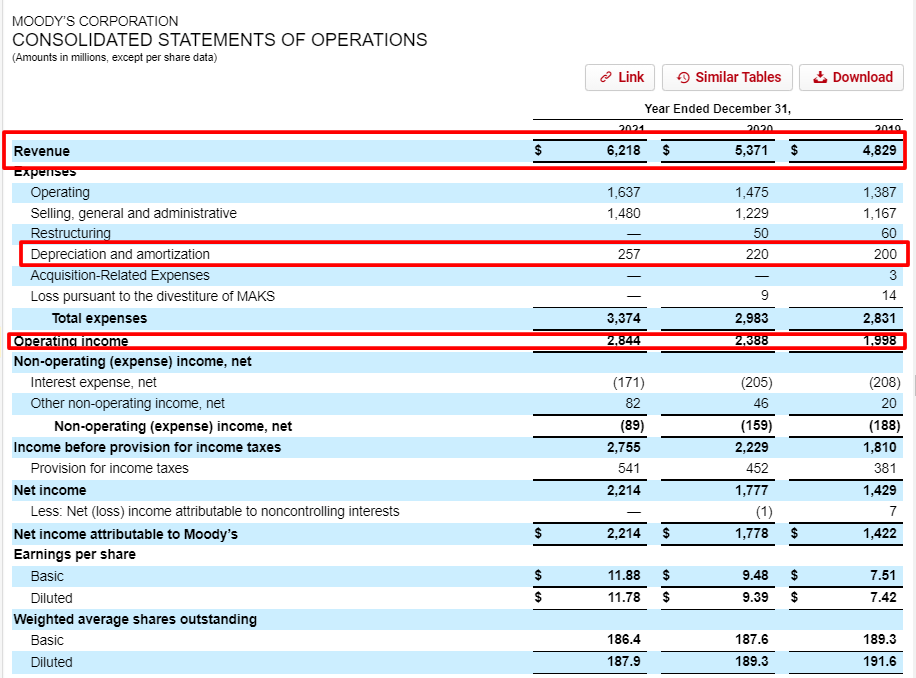
The first step will be to look at the latest 10-K for Moody’s and highlight the numbers we need to calculate the margin.
The formula for the EBITDA margin is:
EBITDA Margin = EBITDA / Total Revenue
Where EBITDA stands for the following three line items:
- Total net revenues
- Depreciation and amortization
- Operating Income
A word of caution is that not all companies will list operating income directly, so you might need to calculate that yourself, which you can find out how to do here. It may be listed as EBIT, or earnings before interest and taxes. On another note, all numbers will be in millions unless otherwise stated.
Pulling out the highlighted sections of the income statement, we get:
- Revenues – $6,218
- Depreciation and Amortization – $257
- Operating Income – $2,844
Now calculate our EBITDA margin with our formula.
EBITDA margin = EBITDA / Revenue
EBITDA Margin = Operating Income + Depreciation and Amortization / Revenue
EBITDA Margin = (2,844 + 257) / 6,218
EBITDA Margin = 49.87%
That was pretty easy; let’s look at a few more.
Next, look at Visa (V), which currently has a market price of $199.86 and a market cap of $413B.
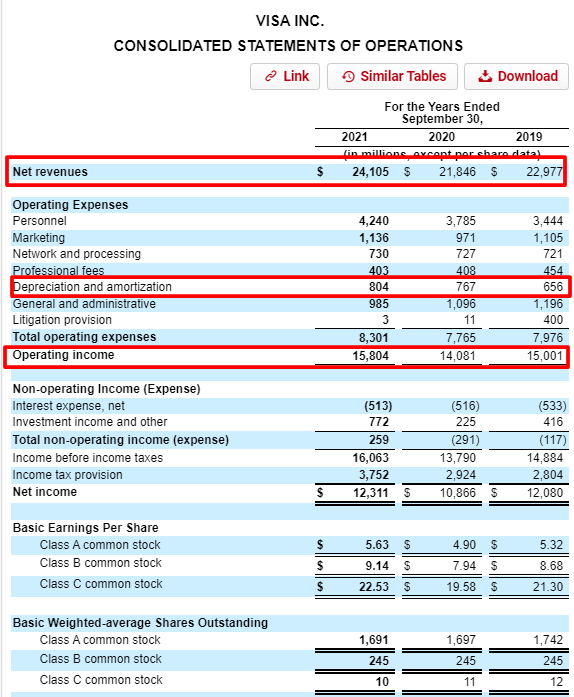
Again I will look up Visa’s 10-K and highlight information from the company’s income statement for our calculations.
Now we will pull the numbers for our calculations from Visa’s income statement.
- Net revenues – $24,105
- Depreciation and Amortization – $804
- Operating Income – $15,804
Now let’s calculate our EBITDA margin.
EBITDA Margin = (15,804 + 804 ) / 24,105
EBITDA Margin = 68.89%
For comparison’s sake, let’s look at the EBITDA margin for Visa from the previous year.
- Net Revenues – $21,846
- Depreciation and Amortization – $767
- Operating Income – $14,081
And now, to find the EBITDA Margin for 2020.
EBITDA Margin = (14,801 + 767) / 21,846
EBITDA Margin = 71.26%
Calculating EBITDA margins over multiple years remains a great practice because it can help you see trends. When analyzing a company, creating a spreadsheet and putting at least five years of metrics like EBITDA on the sheet is a great practice to spot trends or isolate atypical years.
Let’s look at the EBITDA margin of some of the more popular companies.
- Meta (Meta) – 40.02%
- Amazon (AMZN) – 10.8%
- Apple (AAPL) – 33.4%
- Netflix (NFLX) – 20.1%
- Google (GOOG) – 34.8%
- Tesla (TSLA) – 20.9%
- Walmart (WMT) – 5.9%
- Target (TGT) – 7.19%
That’s a decent cross-section of some of the bigger companies, including the FAANG stocks, which was interesting to see their performances.
Now let’s move on to the results and compare them across different sectors.
Do You Want a High or Low EBITDA Margin?
The above question remains easy to answer; the higher, the better. A low margin indicates a company continuing to struggle to maintain profitability and might have issues with cash flow.
A company with a high EBITDA margin is stable, and the earnings are reliable.
A higher EBITDA margin is a favorable comparison to its peers. For instance, Target’s EBITDA margin is higher than Walmart’s, which indicates that Target is the more profitable company, at least for the last twelve months.
Here is a small listing of the industries with the highest and lowest EBITDA margins as of 2022.
Highest:
- Green & Renewable Energy – 55.09%
- Railroads – 46.63%
- Tobacco – 43.32%
- Utility (Water) – 42.58%
- Precious Metals – 41.93%
- REIT – 41.28%
Lowest:
- Air Transport – (28.57)%
- Hotel/Gaming – (9.07)%
- Bank (Money Center) – 0.0%
- Brokerage/Investment Banking – 0.94%
- Oilfield Svcs/Equip – 2.24%
- Real Estate (Operations & Services) – 2.77%
So comparing Walmart and Target to both the retail segments, general and food, it appears that both remain more profitable than the sector overall. Also, notice that Amazon, which had the lowest EBITDA of the FAANG stocks, remains much higher than the general retail.
It is also possible to use the EBITDA margin across different industries. We can see that Facebook remains far more profitable than Walmart, along with Visa, which resides at the top as the most profitable of all the companies we analyzed today.
Final Thoughts
The EBITDA margin offers us another metric we can add to our toolbox to help us find profitable companies that generate great cash flow. The metric is not difficult to calculate, and most companies provide you the information quite readily on their income statements.
You will notice the metric all over the earnings reports that each company releases every quarter – partly because it has become an accepted metric – but also because it falls outside GAAP accounting and the 10-Q reports don’t require auditing. Thus, EBITDA continues as an acceptable metric. It is far less common in the annual reports because those results require auditing and follow GAAP accounting much more closely.

The EBITDA metric also uses Enterprise value, sales, and revenue. But the main goal of the EBITDA margin exists to tell us quickly how profitable the company is and how well they create cash flow. Some analysts use the EBITDA metric as a substitute for free cash flow when calculating intrinsic value, but I wouldn’t recommend that as it remains flawed as an intrinsic value measurement because of the treatment of depreciation and amortization. No one argues that those items are not cash but their accounting treatment. But the fact remains that they are cash items paid out of the cash flow statement, which functions as the company’s checking account.
Using the EBITDA margin and other profitability margins gives us a true sense of the company’s profitability and avoids overestimating your company’s worth.
That will wrap up our discussion for today; as always, thank you for taking the time to read this post.
I hope you find some value in the post and that it helps you to become a better investor.
If I can be of any further assistance, please don’t hesitate to reach out.
Until next time.
Take care and be safe out there,
Dave
Related posts:
- The 3 Main Profitability Ratios Used; with Average Industry Profitability Stats Updated 3/6/2024 Profit remains the goal of every business worldwide, but how do we track a company’s profitability and compare it to another’s? Profitability margins...
- Is Depreciation an Expense? Is EBITDA Deceitful? Well, it Depends From a purely accounting standpoint, the answer to “is depreciation an expense” is that yes it is, both in the income statement and the cash...
- Free Cash Flow Yield – Finding Gushing Cash Flow for Future Growth Cash is king, and free cash flow acts as the engine’s oil. Determining free cash flow and its different uses remains a fantastic way to...
- Cash Flow Analysis Example Using Cash Flow Ratios Everyone Should Know Updated 4/4/2024 “There is a huge difference between the business that grows and requires lots of capital to do so and the business that grows...

