Updated 4/21/2023
After much effort, you have finally mastered value investing. You now know how to identify good companies and value them. You also only invest in those that trade at a significant discount to the intrinsic value.
But success in investing comes from a combination of skill and luck. To protect yourself against bad luck, you have been told to manage risks. Easier said than done.
It has been drummed into your head that value investors don’t consider volatility as risk. The value investor risk mantra is “permanent loss of capital”.
So, you throw out the Beta, standard deviation, Sharpe ratio and all other risk metrics that are based on volatility. Do you know what happens when you do this? There are then hardly any resources left on how to assess and manage risk.
I met the same predicament years ago.
At the end of the day, I had to tap into my corporate risk management experience to come up with an investment risk management framework. I will also share with you this framework and the choices I made in establishing my own risk management plan.
In this post, I will cover the following:
- What is risk
- Start with a global approach
- Key concepts from corporate risk management
- Identifying the root causes
- Assessing the risks
- Risk mitigation
- Summary
Editor’s Note: The article is from H.C. Eu who blogs at Investing for Value. He is a self-taught value investor and has been investing in Bursa Malaysia and SGX companies for more than 15 years.
1. What is risk
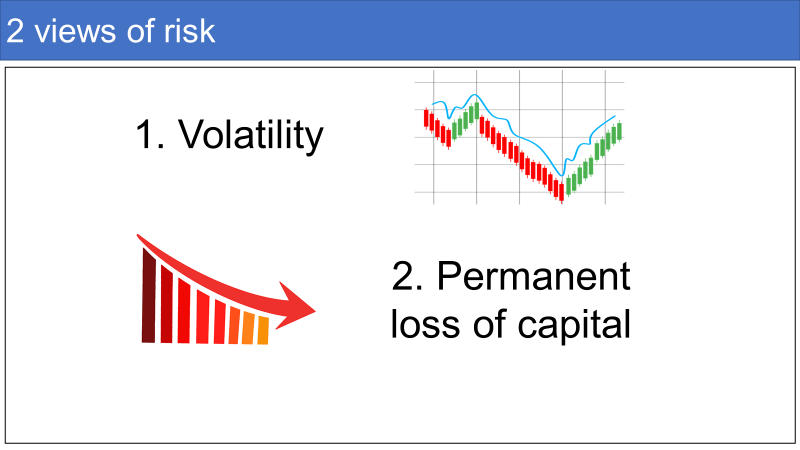
In investing there are 2 schools of thought when it comes to risk.
- Those that view it as volatility.
- Those that view it as permanent loss of capital.
The former has lots of academic credentials. The theory has developed to a stage where risk can be modelled mathematically. Furthermore, risk is separated into systemic and non-systemic risks. You can diversify the non-systemic risks. You live with the systemic risks by demanding higher returns for the higher risks you take.
Refer to The 8 Main Types of Investment Risk. if you want a refresher on how to assess risks based on volatility measures.
Unfortunately for us value investors, there is very little academic research into the permanent loss of capital. I hope this post helps to fill some of the gap.
You would think that the first step is to identify the threats than can lead to a permanent loss of capital when you invest in stocks.
I don’t do this first because your most important capital is your net worth. Your first task is to then look at how to protect your net worth.
2. Start with a global approach
You invest to protect the purchasing power of your savings from being eroded by inflation. Of course, you also want to grow wealth at the same time.
If you know which asset or stock would give the best return, you would be an idiot not to put all your money into this one asset or stock.
The reality is that you cannot foresee the future and so you spread your savings to several assets (or stocks). You hope that if one asset (or stock) does badly, the others would do well enough to more than offset the bad one.
This the rationale behind asset allocation and/or stock portfolio.
The first step then is to have an asset allocation plan where stocks are probably one of the asset classes.
There are many ways to allocate your assets. There are several posts on this subject eg Strategic Asset Allocation: Unique in Nature, Critical for an Uncertain Future. Refer to them as they are the starting point of any risk management plan.
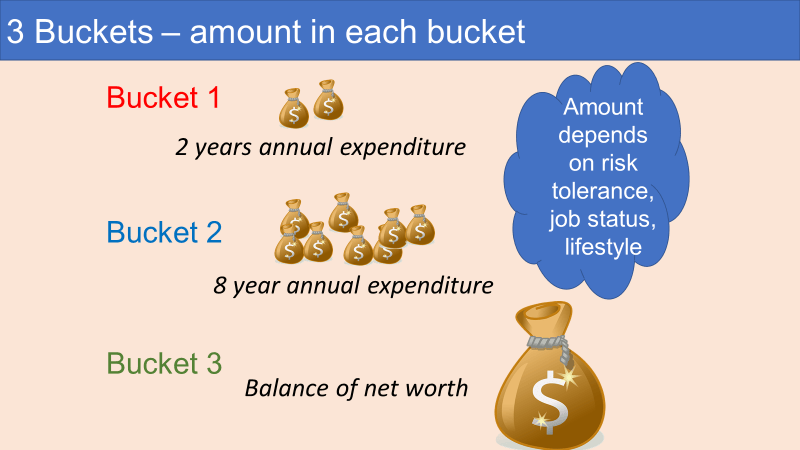
Personally, I follow a 3 Buckets strategy where I have:
- Bucket 1 – liquid assets. This is money kept with the bank that is meant to serve as emergency funds. I can then avoid a situation where I am forced to sell the risky assets at the wrong time to cover unforeseen cash needs. I have 2 years of annual expenditure here.
- Bucket 2 – safe assets. These are assets where the principal is protected eg govt bonds. These serve two purposes. Firstly, to give good returns when the risky assets don’t do well. But more importantly, it serves as a “floor net worth” in case all my risky assets tank. I have another 8 years of annual expenditure here.
- Bucket 3 – volatile or risky assets. These have historically delivered the best returns but can be volatile in the short term. The balance of my net worth is here. I have an equal amount invested in stocks and real estate. This is because in Malaysia where I live both have delivered about equal returns over the past 20 years.
My point is that you should start with an asset allocation plan as this will determine the amount you set aside for stocks.
2.1 Focus vs concentration
You have determined the amount set aside for stocks. The next step is to determine how many stocks to own in your stock portfolio.
I am a bottom-up stock picker and I look at my stock portfolio from a risk management perspective.
The goal is to have a portfolio of uncorrelated stocks so that they all don’t move together in one direction. In reality, you don’t want them to all go down together but would love to have them all go up together!
The more stocks you have the lower the risk of a portfolio loss. But then you also reduce the gain from the portfolio. On the other hand, the more concentrated the portfolio, the higher the portfolio gain. But then the risk of a portfolio loss increases.
If you want further insights into the trade-offs refer to What is a good number of stocks to own?
Studies have shown that the benefits of diversification become marginal when you go beyond 30 stocks.
I target 30 as a working number. I then ensure that these 30 stocks are not correlated by having stocks with different business characteristics. My portfolio then comprises of stocks from:
- Several industries or sectors.
- Different parts of the world.
- Different ownership structures eg founder-led vs institutionally-owned.
- Different business situations eg compounders vs turnarounds.
This post is not about how to construct and manage a stock portfolio. But a good stock portfolio plan is one where you have guidelines on the cap for
- A single stock. For my own portfolio, the maximum I would invest in a stock is 8 % of the portfolio amount.
- A single sector and/or other characteristics. For my portfolio, the maximum I would have for any particular characteristics is 30 % of the portfolio amount.
The trick is to cut and dice the portfolio so that you are not concentrated on one particular characteristic. The goal is to have a diversified stock portfolio as part of your risk management plan.
Then when you review your stock portfolio, you don’t just monitor returns but also check that the “uncorrelated” plan is still intact.
2.2 Stock investment process
You have determined how much of your net worth should be set aside for stocks. You have also ensured that you have a diversified stock portfolio.
Your next step is to ensure that you have an investment process. This is to enable you to assess risks and incorporates the various risk mitigation measures.
You don’t have an investment process? If you are concerned about risk mitigation, you must start with this. If it has not clicked, the Value Trap Indicator Packages is an investment process.
“The investment process outlines the steps in creating a portfolio, and emphasizes the sequence of actions involved from… asset allocation and selection to performance evaluation.” Damodaran
I like to think of my investment process as a SOP (Standard Operating Procedures). It is a set of steps I follow to get to the investment decision. The key feature is repeatability.
I document how I screen stocks, how I analyse and value companies and the criteria for selecting the investment. I even have worked examples to serve as references. Finally, I standardize my financial model so that I do not miss any data when I analyse companies.
I am sure that you all have your own investment process. But I am sure not all of you have them documented. I would advise you to do this.
You need this if you are going to assess your investment process from a risk management perspective. This will ensure that you don’t miss any steps and you have a way to review what you have done.
3. Key concepts from corporate risk management
“Risk management encompasses the identification, analysis, and response to risk factors that form part of the life of a business. Effective risk management means attempting to control, as much as possible, future outcomes by acting proactively rather than reactively.” Corporate Finance Institute
In the corporate world, risk management is considered a discipline by itself. The discipline has evolved over the years and became more widespread with the growth of corporate governance.
Today there is even an ISO 31000 standard for risk management. This provided the principles and guidelines for effective risk management.
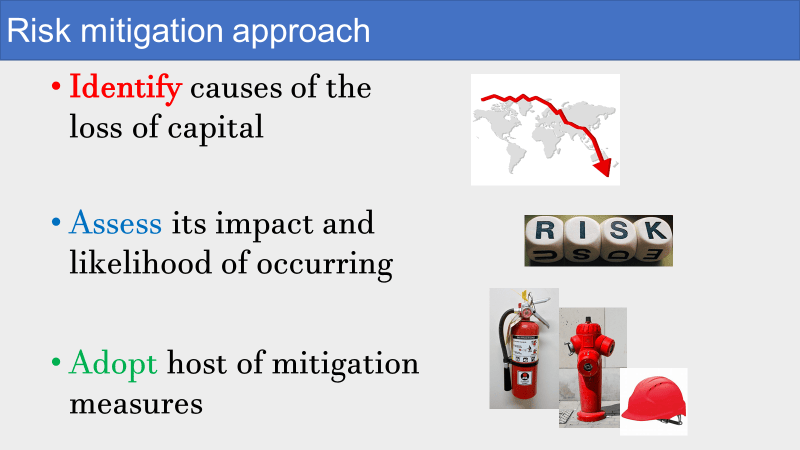
The risk management process involves the following steps:
- Identify the causes that can lead to the risk.
- Assess the impact and the likelihood of the occurrence.
- Adopt the mitigation measure to manage the risk.
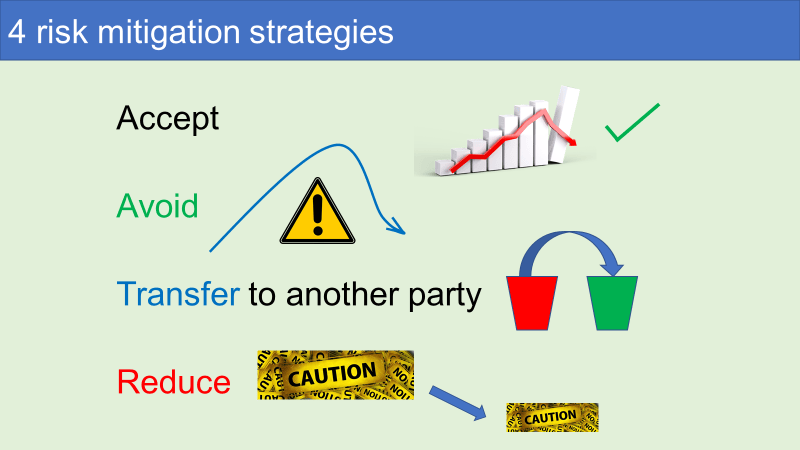
The risk mitigation measures you adopt will of course depend on your own situation. In general, the strategies to manage them cover:
- Avoid – what can be done to prevent it from happening.
- Reduce – how to minimize the impact of any risks?
- Accept – in some instances where the cost of mitigation outweighs the benefit of the mitigation strategies, it may be better to live with the risk.
- Transfer – is there a way to transfer the risk and/or the consequences to another party?
If you consider the permanent loss of capital as risk, there is no reason why you cannot use the risk management framework to manage risk.
3.1 Assessing the risks
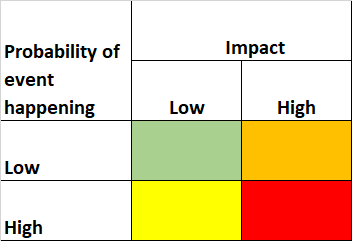
The goal of risk assessment is to evaluate the likelihood of occurrence of each of the causes/threats and their impacts.
I classify each into one of the following 4 coloured cells as per the Threat Matrix below based on:
- The assessment of its impact. Think of the impact as the amount of permanent capital lost.
- The likelihood of it occurring.

This is of course a qualitative assessment. But I find that it ties in neatly with the value investing approach.
For you to be able to assess and value companies, you need an in-depth understanding of the business, the competitors and the industry. That is why staying within your area of competence is important. You tap into the same pool of knowledge to carry out the risk assessment.
It is important to be able to slot the various causes into the appropriate cells of the Threat Matrix as it helps to determine your mitigation measures.
4. Identifying the root causes
It is obvious that identifying all the causes of investment risks is critical. So, when I first started to think about risk, I spent a lot of time researching investment risk literature. I wanted to produce a universal list of investment risks.
It is very sad to say that there is a lot of muddled thinking out there.
For example, I have come across an article that described 4 ways to mitigate risks. It then went on to cover diversifying into different sectors, countries, market capitalization and styles. To me it was only one measure ie diversification.
Many people also confuse between cause and effect. Some of the recommended risk strategies don’t address the root causes.
I spent my early work life as a manufacturing engineer with quality management as a key role. I learned the meaning of cause and effect.
If a particular activity was the cause of a defect, once you stop the activity the defect should go away. If the defect still persists, then that activity is not the cause. You then have to dig deeper as what you thought was “a cause” was actually “an effect”.
This is where the Ishikawa or fishbone diagram came in.
4.1 Ishikawa diagram
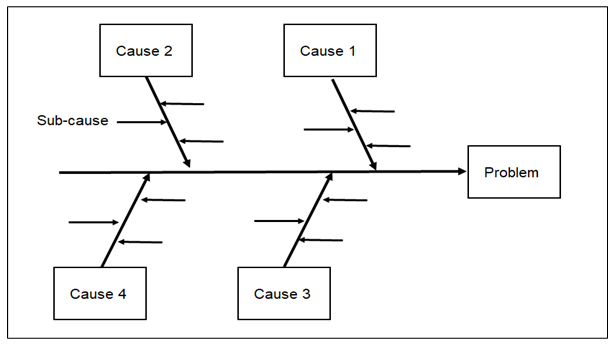
An Ishikawa diagram shows the causes of an outcome and is often used in manufacturing to show where quality control issues might arise.
It is sometimes referred to as a fishbone diagram. It resembles a fish skeleton, with the “ribs” representing the causes and the final outcome appearing at the head of the skeleton. In such a diagram.
- The head of the fish is created by listing the problem and drawing a box around it.
- A horizontal arrow is then drawn across the page with an arrow pointing to the head, this acts as the backbone of the fish.
- The key causes are identified that might contribute to the problem. These causes are then drawn to branch off from the backbone with arrows, making the first bones of the fish.
- For each key cause, the root causes of the problem are identified. These contributing factors are written down to branch off their corresponding key cause.
- The chart below shows the structure of an Ishikawa diagram.
4.2 Possible causes of permanent loss of capital
My research has provided a list of all the possible causes of a permanent loss of capital. The next step was to frame them in a cause-and-effect format using the Ishikawa diagram.
I would hasten to add that you may have your own way to frame the various cause-and-effect. The point is not to debate who has the better fishbone.
The fishbone diagram is a means and not the end. The most important thing is that it provides you with a framework to think about the risks.
The way I see it, to suffer a permanent loss of capital, the investment has to be sold at a price that is lower than the buying price. For simplicity, I will ignore the situation where the investment has been sold due to short-term volatility. From a value investment perspective, this is unlikely to happen.
Rather I assumed that any loss is because the price is “permanently” below the purchased price due to the following direct reasons:
- Deterioration in the intrinsic value due to changes in the fundamentals.
- Issues with portfolio construction.
- Wrong assessment of intrinsic value in the first place.
- Stock market changes.
These are the main direct causes and there are other root causes for each of them.
To help identify the root causes, I used the Ishikawa fishbone diagram with the results as shown below.
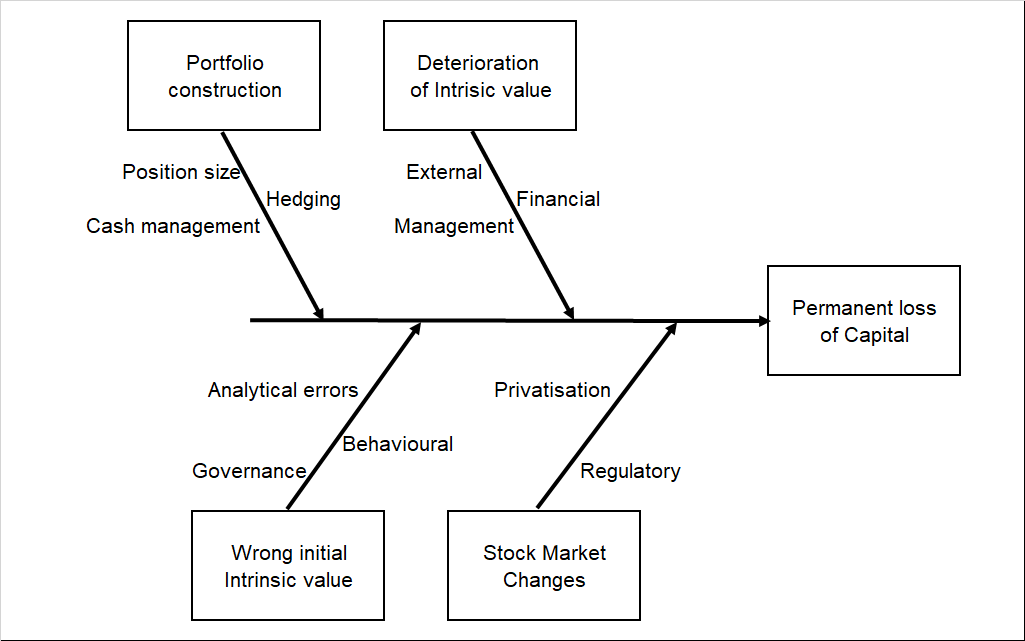
The details of each of the root causes for the boxed items in my Ishikawa diagram are presented below.
4.2.1 Deterioration of intrinsic value
The intrinsic value of a company could decline over time. Over the long term, the market price will decline to reflect this.
- Management could be the cause of the decline. This could be adopting the wrong strategy or plain incompetence
- Financials – if the company has debt, there could be changes to the loan situation eg higher interest rates that affect its profitability or cash flow
- External – this covers all the social, political and economic changes that negatively impact the company. I would include technological changes here as well.
4.2.2 Portfolio construction
- Position size. This relates to the number of stocks in the portfolio and the amount to be allocated to each stock.
- Cash management. From an individual investor perspective, the amount of cash you hold affects your holding power. You should have enough to handle emergencies without being forced to sell your shares at the wrong time. The amount of cash also affects the ability to take advantage of the market but I don’t see this as critical in the context of a permanent loss of capital.
- Hedging refers to other strategies of guarding against risk eg taking a short position
4.2.3 Wrong initial intrinsic value
The assessment of intrinsic value is the heart of value investing. If this was wrongly assessed at the start, the purchase would be a mistake that would be realized much later.
- Governance. The intrinsic value is generally assessed based on the financial statements. If there are issues due to the poor quality of earning or even creative accounting, the computed intrinsic value would be wrong.
- You could have made some analytical errors in assessing the intrinsic value. You are more likely to make errors if the company has a more complex business model
- Your behavioural biases can skew your estimates of intrinsic value. Again, there is a high likelihood of more behavioural biases in analysing and valuing a company with a complex business model.
4.2.4 Stock Market Changes
- Privatization – you are sometimes forced to sell at below your purchased price due to a privatization/corporate exercise
- Regulatory – these relate to rules that affect the availability of the stock eg trading restrictions. There is a “feedback loop” here. If the business deteriorates there is a higher likelihood of some listing guidelines that may affect its liquidity.
The above Ishikawa diagram shows the first level cause-and-effect. You can have a second or even third level cause-and-effect diagram for the more complex cases.
For example, in the case of the External factors, you could further break it down into
- Different economic factors eg interest rate, GDP growth, inflation
- Different social factors eg demographic trends, migration patterns
The key thing is that you must be able to link a cause to the permanent loss of capital. If cannot describe how it can result in a permanent loss of capital, it has no place in the Ishikawa diagram.
5. Assessing the risks
Where are we now?
- You have your investment process.
- You have the causes of a permanent loss of capital.
You now have to look at them to assess the impact and the likelihood of the cause happening. The goal is to slot each cause into the appropriate cells in the Threat Matrix
Determining the likelihood of the cause is a judgement call based on your own investing experience.
Over my past 15 years of value investing, there have been several occasions where I have suffered a permanent loss of capital.
- Once or twice, my whole investment was wiped out because the companies went into liquidation following some fraudulent practices.
- I have sold stocks incurring some losses after waiting 10 years for the market to re-rate. Actually, I lost patience.
I have then my used this experience to classify the various causes into “high” or “low” probability ones. If you don’t have sufficient experience with bad investments, I would suggest that you play safe and classify a cause as “high probability” if you are not sure.
When it comes to assessing the impact, I think along the following lines
- If it impacts the whole portfolio, I classify it as “high impact”
- If it affects a single stock, then I look at the consequences. If it can wipe out the whole investment, I classify it as ‘high impact”. If it only reduces a small % of the investment, I classify it as “low impact”
For example, I would consider a deterioration in the intrinsic value due to poor management as a “high impact” one.
For my investment process, the following fall into the red cells
- Deterioration in the intrinsic value – poor management
- Wrong initial intrinsic value – behavioural
- Stock market changes – privatization
The idea of slotting the various risk into the 4 cells is because it will help you identify the risk mitigation measures.
Remember the 4 mitigation measures – Avoid, Reduce, Accept and Transfer?
There are costs associated with each of these mitigation measures so it is important to have an idea of which cell a particular risk falls into. Generally
- I would “Accept” the risks that fall into the green cell
- I would “Avoid” or “Transfer” the risks that fall into the red cell
- I would “Reduce” or “Transfer” the risks that fall into the orange cell
- I am ambivalent on what to do when it comes to the yellow cell
I must admit that this is a qualitative process. There is a lot of judgement call. I did try to associate a number with each cell to transform this into a quantitative approach. But I gave it up as I could not find a basis to allocate the value to each cell.
6. Risk mitigation
Once you have identified and assessed the risks, you can then formulate the appropriate measures to mitigate the risks.
Some of the common measures include
- Diversification
- Having a margin of safety
- Having a SOP to reduce behavioural biases
- Stay within your circle of competence
- Being conservative
I have a post in my blog with a comprehensive list of risk mitigation measures. You can refer to “How To Mitigate Risks When Value Investing”
My point is that the measures you adopt will depend on your investment process and the risks you face.
Conceptually, think of a matrix where each row represents a particular cause of a permanent loss of capital. Then each column in the matrix represents each of the mitigation strategies – Avoid, Reduce, Accept and Transfer. For want of a better description, I call this the Risk Mitigation Matrix.
You then look at each of the causes and figure out the best risk mitigation strategies. Best in my context means:
- It can effectively or comprehensively address the cause.
- The cost of implementing the strategy is something bearable. I have judged that the benefits outweigh the costs.
- It applies to several risk causes.
Furthermore, if you view risk as a function of both the likelihood of the cause and the impact, then depending on the nature of the risk
- Some of the measures focus on the likelihood
- Some focus on the impact
- Some cover both likelihood and impact
6.1 My Risk Mitigation Matrix
The chart below summarizes my risk mitigation measures in the Risk Mitigation Matrix format.
The thing that is missing from that chart is the “Transfer” measures. This is because it applies to all the causes. To transfer some of the risks, I have some of my net worth invested in unit trusts and properties. These have a different risk profile than those of stocks.
You will also note that asset allocation and stock portfolio are part of my mitigation strategies
- “3 Buckets” is part of my asset allocation measures
- “Diversify” and “More of high conviction” is part of my stock portfolio measures
There are also some empty cells in my Risk Mitigation Matrix. This is because I could not formulate an appropriate risk mitigation measure.
Furthermore, remember the Threat Matrix? For those risks that fall into the red cell, you should not have any blank cell in the Risk Mitigation Matrix.
I have identified the following in my investment process as falling into the red cells.
- Deterioration in the intrinsic value – poor management
- Wrong initial intrinsic value – behavioural
- Stock market changes – privatization
Accordingly, if you look at my Risk Mitigation Matrix, you will see that there are measures in all the related cells. In fact, there are more than one measure for some of them.
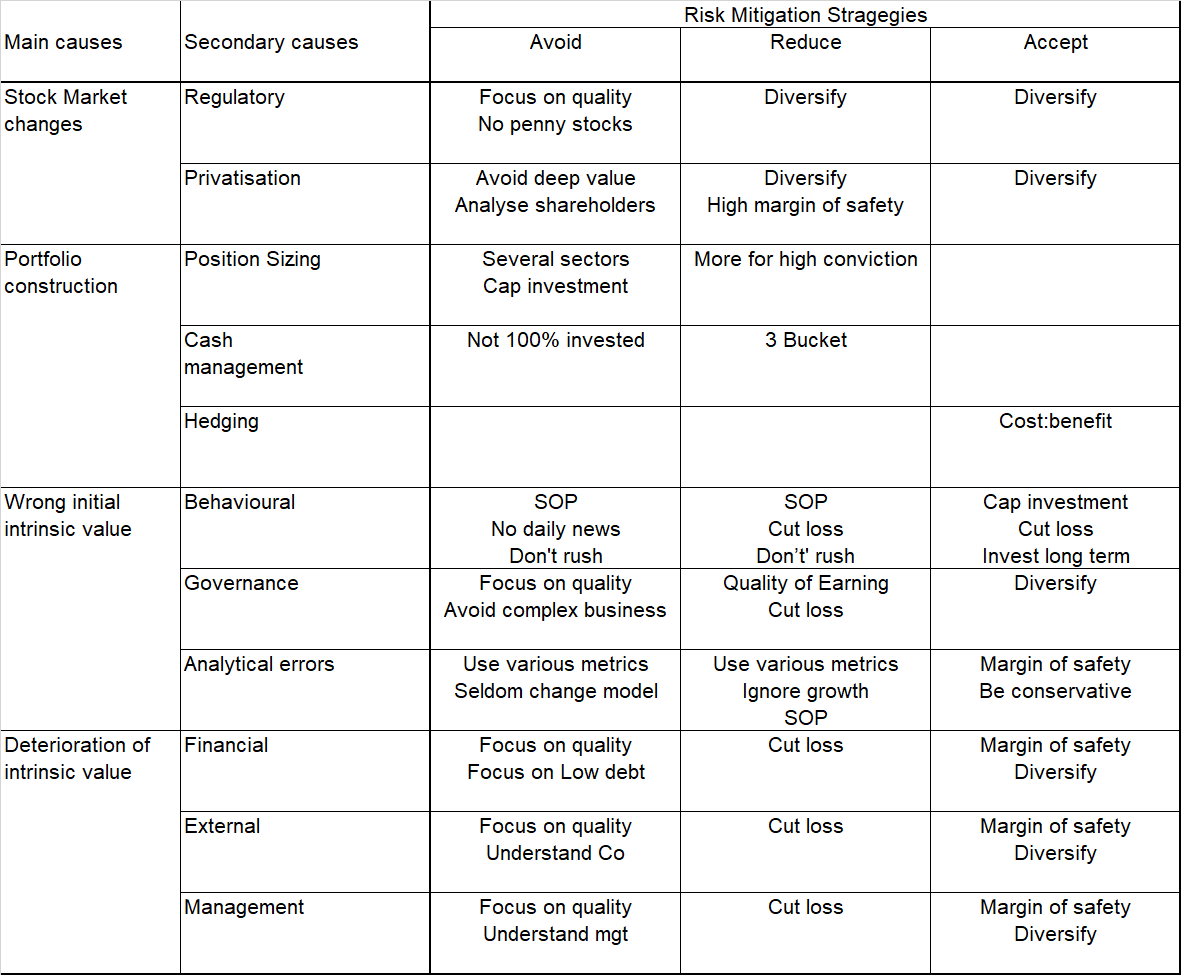
Most of the measures adopted a self-explanatory. But for some others, I provide a brief description (in alphabetical order) as follows:
- Analyze shareholders – privatization will also depend on whether the controlling shareholder sees any advantages in maintaining the listing status.
- Avoid deep value – deep value stocks are those that are generally trading at a deep discount to the Asset values. These are potential privatizations
- Cost-benefit – only hedge if the benefits outweigh the cost
- Cut loss – be prepared to sell and cut loss if you have made an error in your analysis and/or valuation
- Don’t rush – this refers to slowly building up or exiting a position. It is likely that you may look at a stock differently when you are invested
- Quality of earnings – this relates to the proportion of income attributable to the core operating activities of a business. You ignore any anomalies, accounting tricks, or one-time events.
- Use various metrics – there are many metrics and techniques when it comes to valuation. Adopt a number of them so as to triangulate the intrinsic value
The focus of this post is not to discuss specific risk mitigation measures. Some of the risk mitigation measures eg margin of safety will require its own post to cover it comprehensively.
Rather my goal is to ensure that you have a way to identify the root causes and have formulated an appropriate measure to mitigate the risks. There should never be a cause with a corresponding mitigation measure.
7. Summary
If you view risk as a permanent loss of capital, then risk mitigation should involve every stage of your investment process.
- Start with an asset allocation plan.
- Dovetail this into your stock portfolio.
- Adopt the corporate risk management process to assess risk and bring it into your investment process.
Risk management involves identifying the threats, assessing, and then mitigating them. You consider both the likelihood of the risk happening and its impact. The mitigation measures involved avoiding, reducing, accepting, and transferring the risk.
I have presented a risk management framework comprising of several elements.
- The Ishikawa diagram to identify the root causes of a permanent loss of capital.
- A Threat Matrix to assess the likelihood and impact of each of the risks.
- A Risk Mitigation Matrix to ensure that we have measures to mitigate each root cause.
I hoped I have shown you how to tie all the various elements of the risk management framework together.
What I have shared with you is my risk management framework 4.0. Over the past decade, there have been several revisions to my investment SOP. Every revision meant a relook at the risk mitigation measures.
There have also been several updates on my valuation model. Actually, each update is about incorporating more risk measures.
- I now include “quality of earnings” into my assessment
- I now incorporate collect data required to compute a number of academic quality metrics eg the Piotroski F-score and the Beneish M-score
I am sure this is not the final version of my risk management framework. As such if you have any thoughts on my framework, I would love to hear from you.
| Specifically, I believe that if I could have 100 fishbones and Risk Mitigation Matrices from value investors all over the world, I could compile a universal fishbone and a comprehensive Risk Mitigation Matrix. So, if you are interest to join in the project, email them to [email protected] or [email protected]. |
There are other things that I have done with the framework eg compare risks between companies. I have also used it to see how my risk profile changed over time. But these are stories for another day.
END

Editor’s Note: The article is from H.C. Eu who blogs at Investing for Value. He is a self-taught value investor and has been investing in Bursa Malaysia and SGX companies for more than 15 years. His value investment experience has been enhanced by both his Board experiences and his contacts with controlling shareholders of many Bursa-listed companies. These have given him a unique opportunity to be able to analyze and value companies differently from other research houses. If you enjoyed this piece, you can find similar pieces and other value investing tips in his blog.
